Hassan malik
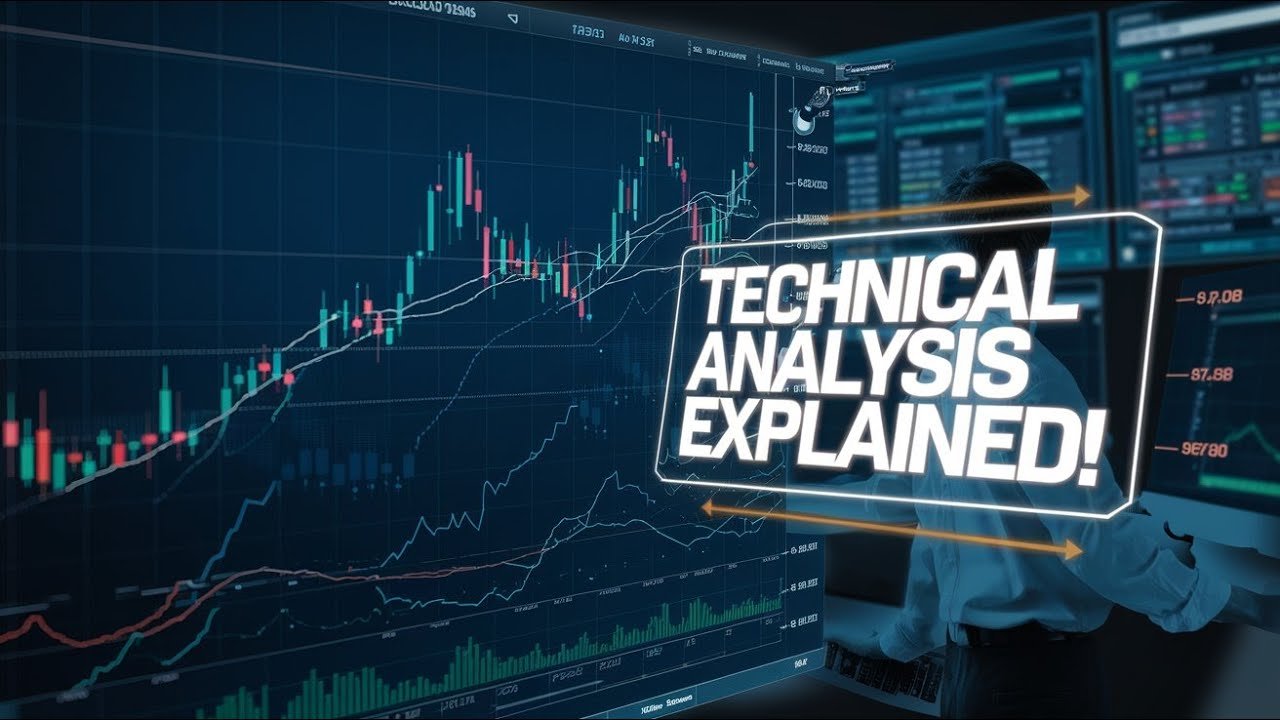
Technical analysis is one of the most widely used methods for studying Technical Analysis financial markets, including cryptocurrency. Instead of focusing primarily on a project’s technology or business model, technical analysis examines historical price movements, trading volume, market structure, and chart patterns to identify potential trends and important price levels.
For beginners entering the cryptocurrency market, technical analysis can initially appear complicated. Candlestick charts, moving averages, RSI, MACD, support and resistance, trendlines, volume, and Fibonacci levels can all seem overwhelming. However, these concepts become much easier to understand when they are studied step by step.
The basic idea behind technical analysis is that historical market data can provide useful information about how price has behaved under different conditions. Traders use this information to identify trends, possible entry and exit areas, momentum changes, and potential risk levels. Technical analysis does not guarantee that a forecast will be correct, because markets can react to unexpected news, economic developments, liquidity changes, and other factors.
In cryptocurrency, technical analysis is particularly popular because crypto markets operate continuously and generate large amounts of price and volume data. Whether someone is studying Bitcoin, Ethereum, or altcoins, understanding how to read a chart can provide a structured way to examine market behavior.
This guide explains the fundamentals of technical analysis for crypto, including charts, trends, support and resistance, candlestick patterns, indicators, volume, market structure, and risk management.
What Is Technical Analysis?
Technical analysis is a market-analysis method that studies historical price and volume data. Analysts use charts and mathematical indicators to examine patterns and market behavior.
The approach is based on several commonly used ideas. One is that price reflects the interaction between buyers and sellers. Another is that market behavior can sometimes form recognizable patterns. Analysts also study whether momentum is increasing or decreasing and whether a trend appears to be strengthening or weakening.
Unlike fundamental analysis, which may focus on technology, financial performance, adoption, development activity, or economic conditions, technical analysis concentrates primarily on market data.
This does not mean that technical analysis can predict the future with certainty. Instead, it provides a framework for interpreting market conditions and developing scenarios based on available information.
How Crypto Charts Work

Understanding Price Charts
A cryptocurrency price chart displays the movement of an asset over a selected period. Depending on the chart type, users can view opening prices, closing prices, highs, lows, and other information.
The most common chart used by crypto traders is the candlestick chart. Each candle represents price activity during a specific period. For example, a five-minute candle represents five minutes of price movement, while a daily candle represents one day.
Timeframes are important because the same cryptocurrency can look bullish on a short-term chart and bearish on a longer-term chart. This is why experienced analysts often examine multiple timeframes before forming an overall market view.
Candlestick Charts
Candlesticks provide information about how price behaved during a particular period. The body shows the opening and closing prices, while the wicks or shadows show the highest and lowest prices reached during that period.
A strong candle with a large body can indicate substantial movement during the selected timeframe. A candle with a small body and long wicks may indicate greater uncertainty or rejection around certain price levels.
For beginners, understanding candlestick charts is an important first step toward learning technical analysis.
Market Trends
A trend describes the general direction in which price has been moving. Analysts commonly discuss uptrends, downtrends, and sideways or range-bound markets.
An uptrend generally features a sequence of higher highs and higher lows. A downtrend tends to show lower highs and lower lows. A sideways market occurs when price remains within a relatively defined range without establishing a clear long-term direction.
Identifying the broader trend can help traders understand the context of individual price movements. A temporary decline inside a larger uptrend may have a different meaning from a decline occurring during an established downtrend.
Trendlines
Trendlines are lines drawn on charts to help visualize directional price movement. An ascending trendline can connect important higher lows, while a descending trendline can connect significant lower highs.
Trendlines are not exact laws. Price can move temporarily above or below them, so analysts generally combine trendlines with other forms of market analysis.
Support and Resistance
Support and resistance are among the most important concepts in technical analysis.
Support refers to a price area where buying interest has historically appeared or where selling pressure has previously weakened. Resistance refers to an area where selling activity has previously increased or upward movement has encountered difficulty.
These levels are better understood as zones rather than perfectly precise numbers. Cryptocurrency markets can move through a level temporarily before reversing or continuing in the same direction.
Why Support and Resistance Matter
Support and resistance can help analysts identify areas where market behavior may change. Traders may monitor these zones for breakouts, rejections, consolidation, or changes in momentum.
When a resistance level is convincingly broken, analysts sometimes watch to see whether that area later behaves as support. Similarly, when support breaks, traders may monitor whether the previous support area becomes resistance.
This concept is often called support and resistance flipping.
Moving Averages
Moving averages are popular technical indicators that smooth price data over a specific period. They can help analysts visualize the broader direction of an asset.
Two commonly used types are the Simple Moving Average and the Exponential Moving Average.
A Simple Moving Average, or SMA, calculates the average price over a specified number of periods. An Exponential Moving Average, or EMA, gives greater weight to more recent prices.
Moving averages can be used to study trends, dynamic support and resistance, and momentum. However, they are generally considered lagging indicators because they are calculated from historical prices.
Relative Strength Index
The Relative Strength Index, commonly known as RSI, is a momentum indicator that measures the speed and magnitude of recent price changes.
RSI is usually displayed on a scale from 0 to 100. Traditional interpretations often consider readings above 70 as indicating potentially overbought conditions and readings below 30 as potentially oversold conditions.
However, these levels should not automatically be treated as signals to buy or sell. During strong trends, an asset can remain at elevated or depressed RSI levels for an extended period.
For that reason, traders often combine RSI with trend analysis, support and resistance, and other market information.
Moving Average Convergence Divergence
The Moving Average Convergence Divergence, or MACD, is another widely used momentum indicator.
MACD compares moving averages to help identify changes in momentum and potential trend shifts. Its chart generally includes a MACD line, signal line, and histogram.
Analysts may study crossovers between the MACD and signal line or examine changes in the histogram. Divergence between price and MACD can also receive attention.
Like other indicators, MACD should not be interpreted independently. Its usefulness depends on the broader market context and the timeframe being analyzed.
Trading Volume in Technical Analysis
Volume represents the amount of an asset traded during a particular period. It can provide additional context for price movements.
For example, a significant price breakout accompanied by increased trading volume may receive more attention than a similar price move occurring with very low volume.
Volume can also help analysts study whether market participation is increasing or decreasing.
In cryptocurrency markets, volume data can vary between exchanges, so traders should understand where their volume information comes from. Reported volume should be interpreted alongside liquidity and market structure.
Breakouts and Fakeouts
A breakout occurs when price moves beyond an important support, resistance, or consolidation area.
Breakouts can occur after periods of sideways price movement when buying or selling pressure becomes strong enough to move price beyond the established range.
However, not every breakout develops into a sustained trend. A fakeout, sometimes called a false breakout, occurs when price moves beyond an important level but then returns inside the previous range.
This is why traders often look for confirmation rather than assuming that every movement beyond resistance or support represents a new trend.
Chart Patterns
Chart patterns are formations that traders identify on price charts. Common examples include triangles, flags, channels, double tops, double bottoms, and head-and-shoulders formations.
Double Tops and Double Bottoms
A double top generally forms when price reaches a similar high twice and struggles to move beyond that area. Traders may interpret the pattern as evidence of resistance, although confirmation is generally required.
A double bottom is the opposite structure, where price reaches a similar low twice and finds buying interest around that region.
These patterns are not guaranteed reversal signals. Market context, volume, support and resistance, and subsequent price behavior can all affect their interpretation.
Triangles and Consolidation
Triangle patterns form when price movement becomes progressively narrower. Analysts commonly identify ascending, descending, and symmetrical triangles.
These formations can represent periods of consolidation in which buyers and sellers are competing within an increasingly narrow range.
A subsequent breakout can provide additional information about the market’s direction, but the breakout itself can still fail.
Fibonacci Retracement
Fibonacci retracement is a technical-analysis tool used to identify potential price areas based on mathematical ratios.
Common Fibonacci levels include 23.6%, 38.2%, 50%, 61.8%, and 78.6%. Traders may apply these levels between significant highs and lows to identify areas where price could potentially encounter support or resistance.
Fibonacci levels should not be treated as guaranteed reversal points. Their usefulness depends on how they interact with broader market structure and other technical information.
Market Structure
Market structure focuses on how price creates highs and lows over time.
An uptrend can be studied through higher highs and higher lows, while a downtrend can be studied through lower highs and lower lows. When this structure changes, analysts may begin examining whether the previous trend is weakening.
Terms such as break of structure and change of character are often used in modern technical-analysis discussions.
Understanding market structure can help beginners move beyond simply looking at individual candles. Instead, they can study the relationship between multiple price movements.
Multi-Timeframe Technical Analysis
Looking at one timeframe can provide an incomplete picture. Multi-timeframe analysis involves examining several chart periods to understand both broader and shorter-term conditions.
For example, a trader might study a weekly or daily chart to understand the broader trend, then examine four-hour or one-hour charts for more detailed market structure.
The exact timeframes used can vary depending on the trading style. Long-term market participants may focus on daily and weekly charts, while shorter-term traders may examine hourly or minute-based charts.
The important concept is that timeframe context can influence how the same price movement is interpreted.
Technical Analysis Indicators Should Not Be Used Alone
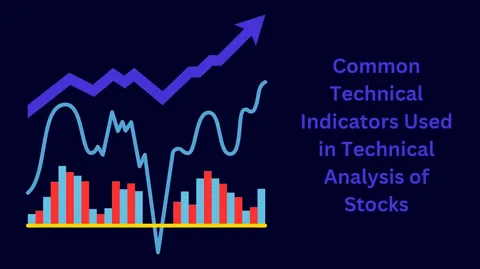
One of the most common mistakes among beginners is placing too much confidence in a single indicator.
For example, an RSI reading below 30 does not automatically mean that an asset must rise. Similarly, a moving-average crossover does not guarantee a new trend.
Indicators are mathematical calculations based largely on existing market data. They can help organize information, but they cannot eliminate uncertainty.
A more structured approach can combine price action, market structure, volume, support and resistance, and selected indicators.
Technical Analysis and Risk Management
Technical analysis can help identify potential market scenarios, but risk management determines how much exposure a trader is willing to accept if an idea does not work.
Risk management can involve position sizing, stop-loss planning, portfolio diversification, and avoiding excessive leverage.
Leverage can magnify both gains and losses. In highly volatile cryptocurrency markets, excessive leverage can result in rapid liquidation.
For beginners, understanding risk is at least as important as learning chart patterns. A technically convincing setup can still fail because markets are uncertain.
Common Technical Analysis Mistakes
Beginners often make mistakes by drawing too many indicators on one chart. A chart filled with moving averages, oscillators, trendlines, and signals can become difficult to interpret.
Another common mistake is searching for patterns that are not clearly present. This is sometimes called overfitting or seeing patterns where random price movement exists.
Emotional decision-making can also interfere with analysis. Fear of missing out can encourage traders to enter after large price movements, while panic can cause decisions during sudden declines.
A consistent analytical framework can help reduce impulsive reactions.
Technical Analysis for Bitcoin and Altcoins
Technical analysis can be applied to Bitcoin, Ethereum, and many other cryptocurrencies. However, different assets can have different levels of liquidity, volatility, trading volume, and market history.
Bitcoin often receives extensive technical coverage because of its large market presence and high trading activity. Altcoins can sometimes experience more dramatic price movements, especially when liquidity is lower.
Therefore, beginners should consider liquidity and market depth when analyzing smaller cryptocurrencies. A chart pattern may behave differently in a highly liquid market compared with a thinly traded token.
How Beginners Can Start Learning Technical Analysis
The best way to learn technical analysis is to build knowledge gradually. Start with candlestick charts, trends, support and resistance, and volume before moving into more advanced indicators.
After understanding these foundations, study moving averages, RSI, MACD, chart patterns, Fibonacci retracement, and market structure.
Practice reading historical charts without immediately placing real trades. This can help beginners understand how patterns developed and how often expected outcomes failed to occur.
Keeping a trading journal can also help organize observations. Recording the reasoning behind an analysis and comparing it with what happened later can reveal weaknesses in a strategy.
The Role of Fundamental Analysis
Technical analysis and fundamental analysis do not necessarily have to compete with each other. They examine different types of information.
Technical analysis focuses primarily on market data, while fundamental analysis can examine technology, adoption, development activity, tokenomics, competition, ecosystem growth, and other factors.
For cryptocurrency research, combining multiple perspectives can provide broader context. A technically strong chart does not necessarily indicate that an underlying project is fundamentally strong, and a technically weak chart does not automatically mean that a project’s technology lacks value.
Understanding the distinction helps investors and traders interpret information more carefully.
Final Thoughts on Technical Analysis
Technical analysis provides a structured framework for studying cryptocurrency price movements. By learning how to read candlesticks, identify trends, recognize support and resistance, analyze volume, and understand indicators such as RSI and MACD, beginners can develop a stronger understanding of market behavior.
The most important point is that technical analysis is not a guaranteed prediction system. Charts show historical and current market data, while future prices remain uncertain.
Successful learning comes from understanding the principles rather than memorizing isolated signals. Combining price action, market structure, technical indicators, volume analysis, and risk management can create a more complete framework for studying cryptocurrency markets.
As you continue learning, focus on consistency, research, and disciplined analysis. Avoid relying on one indicator or assuming that a particular chart pattern must produce a specific result. Cryptocurrency markets can change quickly, making flexibility and risk awareness essential.
Frequently Asked Questions
What is technical analysis in crypto?
Technical analysis is the study of historical price and volume data to identify trends, market structures, support and resistance levels, momentum, and potential price scenarios.
Is technical analysis accurate?
Technical analysis does not guarantee accurate predictions. Indicators and chart patterns are tools for interpreting market data, and unexpected events can cause price movements that differ from technical expectations.
What is the best indicator for beginners?
There is no single indicator that works in every market condition. Beginners often start by learning moving averages, RSI, volume, and support and resistance before exploring more advanced tools.
Can technical analysis be used for Bitcoin?
Yes. Technical analysis is widely applied to Bitcoin and other cryptocurrencies. Analysts can study Bitcoin using candlestick charts, market structure, volume, moving averages, RSI, MACD, and other tools.
Is technical analysis enough for crypto trading?
Technical analysis can provide useful market information, but it does not Technical Analysis eliminate risk. Traders may also consider fundamental factors, market conditions, liquidity, news, risk management, and their own financial circumstances.