Hassan malik
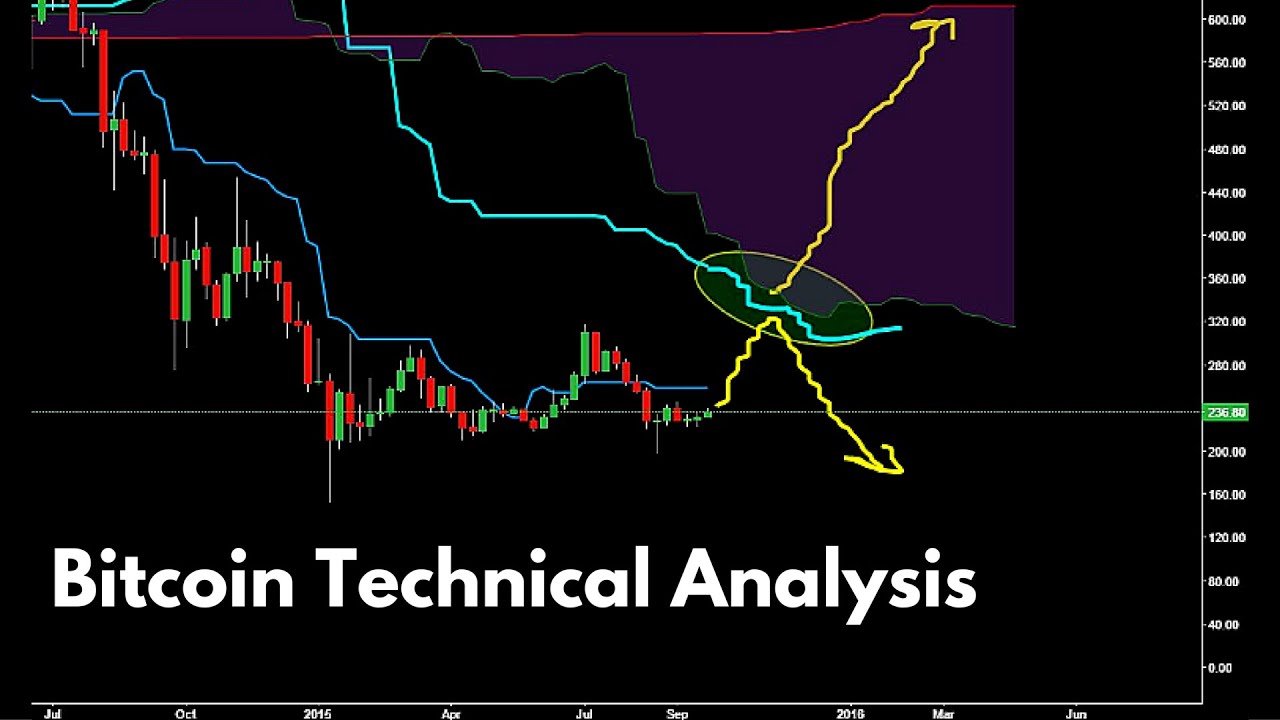
Bitcoin Technical Analysis is a widely used method for studying the Bitcoin Technical Analysis price behavior of Bitcoin through charts, historical data, trading volume, momentum, and market structure. Instead of relying only on news or fundamental developments, technical analysis focuses on how buyers and sellers have behaved in the market and what current price action may reveal about market conditions.
Bitcoin is particularly suitable for technical analysis because it has a long trading history and is actively traded across global markets. Traders commonly study BTC price trends, support and resistance, moving averages, candlestick patterns, RSI, MACD, trading volume, and market momentum to understand different market conditions.
Recent market developments have also highlighted why Bitcoin technical analysis needs to be interpreted carefully. In September 2026, Bitcoin moved through several important technical areas. CoinDesk reported that BTC moved above its one-year average and that traders were watching whether the cryptocurrency could maintain its position above the 200-day average. Earlier in the month, Bitcoin had faced resistance around the $83,000 area, while a golden-cross setup attracted attention from technical analysts.
These developments demonstrate an important principle: no single indicator explains the entire Bitcoin market. A more complete approach combines multiple indicators with price structure, volume, macroeconomic conditions, and risk management.
What Is Bitcoin Technical Analysis?
Bitcoin Technical Analysis is the process of examining historical BTC price data to identify trends, patterns, momentum, and important market levels.
Technical analysts generally assume that market price contains information about the combined actions and expectations of market participants. By studying price charts, traders attempt to understand whether Bitcoin is trending upward, moving downward, or consolidating within a range.
Common tools include support and resistance, moving averages, RSI, MACD, Fibonacci retracement, trendlines, candlestick patterns, and volume.
Technical analysis does not guarantee future results. Instead, it provides a structured framework for interpreting market behavior.
Why Bitcoin Technical Analysis Matters
Bitcoin can experience substantial price movements over short periods. These movements can be influenced by liquidity, investor sentiment, interest rates, institutional activity, regulation, economic data, and cryptocurrency-specific developments.
Technical analysis can help organize this information through observable market behavior.
For example, traders can identify whether BTC is making higher highs and higher lows or whether it is creating lower highs and lower lows. They can also monitor whether trading volume supports a breakout or whether momentum is weakening.
This makes Bitcoin price analysis useful for understanding both short-term and longer-term market structure.
Understanding the Bitcoin Price Chart
The foundation of technical analysis is the Bitcoin price chart.
Candlestick charts are commonly used because each candle provides four basic pieces of information: the opening price, closing price, highest price, and lowest price during a selected period.
A one-hour candle represents one hour of price activity, while a daily candle represents an entire day.
The timeframe can significantly change the appearance of the market. Bitcoin can look bullish on a short-term chart while remaining within a broader consolidation structure on a weekly chart.
For this reason, traders often examine multiple timeframes before forming a technical view.
Bitcoin Market Trends
Identifying the Bitcoin market trend is one of the most basic elements of technical analysis.
An uptrend generally contains a series of higher highs and higher lows. A downtrend generally produces lower highs and lower lows. A sideways market occurs when price remains within a relatively defined range.
Bitcoin does not always move in a straight line. Even during an uptrend, temporary corrections can occur.
Likewise, a short-term recovery inside a larger downtrend does not necessarily mean that the longer-term trend has completely changed.
Understanding this distinction can help prevent traders from interpreting every short-term price movement as a major trend reversal.
Bitcoin Support Levels
Bitcoin support refers to a price area where buying activity has previously helped slow or reverse a decline.
Support should generally be viewed as a zone rather than an exact number because markets rarely react with perfect precision.
A support area can develop around previous lows, moving averages, psychological price levels, or areas where significant trading activity occurred.
In September 2026, Bitcoin’s $77,000 area received significant market attention during a period of weakness. CoinDesk reported that BTC approached approximately $76,270, which traders were watching as an important technical support level.
Support levels can change as market conditions evolve.
Bitcoin Resistance Levels
Bitcoin resistance is an area where selling pressure has previously limited upward movement.
Resistance can develop around previous highs, major psychological levels, moving averages, or areas with substantial historical trading activity.
In early September 2026, Bitcoin encountered notable resistance around $83,000. CoinDesk reported that BTC struggled around that level while wallet cohorts were showing distribution.
A resistance level is not guaranteed to stop a rally. If buyers push price above resistance with strong participation, the market may enter a new trading range.
Bitcoin Breakouts
A Bitcoin breakout occurs when BTC moves above a significant resistance area.
Technical traders often look for confirmation rather than assuming that every move above resistance will continue.
Trading volume can be one source of confirmation. A breakout accompanied by stronger volume may indicate greater market participation than a breakout occurring on weak activity.
However, Bitcoin can also experience false breakouts.
A false breakout occurs when price moves above resistance but later falls back below the level.
Bitcoin Breakdown
A Bitcoin breakdown occurs when price falls below a significant support area.
Breakdowns can indicate that selling pressure has increased and that the previous market structure may be changing.
However, just as with breakouts, not every breakdown produces a prolonged decline.
A temporary move below support followed by a rapid recovery can become a false breakdown.
Traders therefore often examine closing prices, volume, retests, and broader market conditions before interpreting a support break.
Bitcoin Moving Averages
Moving averages are among the most widely used tools in Bitcoin Technical Analysis.
A moving average smooths price data over a specific number of periods.
Commonly monitored averages include the 20-day, 50-day, 100-day, and 200-day moving averages.
Shorter averages react more quickly to changes in Bitcoin’s price, while longer averages provide information about broader market trends.
The 200-day moving average is particularly important because many traders use it to evaluate Bitcoin’s longer-term market structure.
In late September 2026, CoinDesk reported that Bitcoin had moved above a key long-term moving average and that maintaining that position was an important technical consideration.
Bitcoin Golden Cross
A Bitcoin golden cross occurs when the 50-day moving average rises above the 200-day moving average.
This pattern is often interpreted as a sign that recent price momentum has strengthened relative to the longer-term trend.
Bitcoin formed a golden cross in September 2026, attracting significant attention from market analysts. CoinDesk noted that the historical record of Bitcoin’s golden crosses has been mixed, highlighting that moving-average signals can be useful but are not guaranteed predictors.
The important lesson is that a golden cross should be considered alongside price structure and other market information rather than treated as an automatic buy signal.
Bitcoin RSI Analysis
The Relative Strength Index, commonly called RSI, measures the strength and speed of recent price movements.
RSI ranges from 0 to 100. Traditional technical analysis often considers readings above 70 as potentially overbought and readings below 30 as potentially oversold.
However, Bitcoin can remain above 70 during a powerful trend or below 30 during a prolonged decline.
This means RSI is more useful as a momentum indicator than as a guaranteed reversal signal.
Traders may also examine RSI divergence, where Bitcoin’s price moves in one direction while RSI fails to confirm the movement.
Bitcoin MACD Analysis
The MACD, or Moving Average Convergence Divergence, is another widely used Bitcoin indicator.
MACD compares moving averages to help analyze momentum and trend changes.
Traders often monitor the MACD line, signal line, and histogram.
A bullish crossover can indicate improving momentum, while a bearish crossover can indicate weakening momentum.
MACD divergence can also attract attention when Bitcoin’s price reaches a new high or low without a corresponding move in momentum.
Like RSI, MACD works best as part of a broader technical framework.
Bitcoin Trading Volume
Bitcoin trading volume provides information about market participation.
When BTC breaks through a major resistance level with strong volume, traders may interpret the movement differently than a breakout occurring with very low volume.
Volume can also help evaluate selling pressure.
A sharp decline accompanied by substantial volume may indicate stronger participation from sellers, although volume alone does not determine future direction.
Bitcoin volume should therefore be studied together with price structure and liquidity.
Bitcoin Candlestick Patterns

Bitcoin candlestick patterns can provide short-term information about buyer and seller behavior.
Common formations include doji candles, hammer patterns, engulfing candles, shooting stars, and other structures.
A bullish engulfing pattern near support may attract attention because it can show a shift in short-term buying pressure.
A bearish engulfing pattern near resistance can provide different information.
However, candlestick patterns are more meaningful when considered in context. A single candle should not be treated as a complete trading strategy.
Bitcoin Trendlines
A Bitcoin trendline connects significant highs or lows on a price chart.
An ascending trendline may connect higher lows during an uptrend, while a descending trendline may connect lower highs during a downtrend.
Trendlines can help traders visualize the direction of price movement.
A break below an established upward trendline can indicate that momentum is weakening, but traders often seek confirmation from additional indicators.
Trendlines are also subjective because different analysts may select different price points.
Bitcoin Fibonacci Analysis
Fibonacci retracement is another popular technical tool.
Traders commonly monitor Fibonacci levels such as 23.6%, 38.2%, 50%, 61.8%, and 78.6% after significant price movements.
These levels can be used to identify potential retracement areas.
Fibonacci levels become more relevant when they overlap with established support, resistance, trendlines, or moving averages.
They should not be interpreted as guaranteed turning points.
Bitcoin Market Structure
Market structure is one of the most important concepts in Bitcoin Technical Analysis.
A bullish structure typically includes higher highs and higher lows.
A bearish structure generally consists of lower highs and lower lows.
A structural break occurs when price violates an important previous high or low.
Market structure can provide context that individual indicators sometimes miss.
For example, RSI may indicate strong momentum, but if Bitcoin is still creating lower highs and lower lows on a larger timeframe, the broader market structure may remain weak.
Bitcoin Multiple Timeframe Analysis
Multiple timeframe analysis involves examining Bitcoin on different chart periods.
A trader may use a weekly chart to understand the long-term trend, a daily chart to study major support and resistance, and a four-hour chart to examine shorter-term market structure.
This approach can prevent short-term price movements from being interpreted without considering the broader market.
Different trading styles require different timeframes.
Long-term investors may focus on weekly and monthly charts, while active traders may concentrate on hourly and four-hour charts.
Bitcoin Technical Analysis and Market Sentiment
Technical indicators do not operate independently from investor psychology.
Bitcoin market sentiment can influence buying and selling behavior.
When traders become highly optimistic, price can move rapidly upward. When fear dominates the market, selling pressure can accelerate.
Technical analysis can sometimes reveal these shifts through momentum, volume, volatility, and market structure.
However, sentiment can change quickly after economic announcements or unexpected news.
Bitcoin and Macroeconomic Factors
Bitcoin does not trade in isolation from the broader financial system.
Interest rates, Treasury yields, inflation data, liquidity conditions, the U.S. dollar, and broader risk sentiment can influence cryptocurrency markets.
In September 2026, Bitcoin experienced periods of pressure as traders responded to changing expectations around U.S. monetary policy and rising Treasury yields. CoinDesk reported that macroeconomic factors were weighing on BTC during periods when markets were reassessing interest-rate expectations.
This demonstrates why technical analysis is often more useful when combined with awareness of major macroeconomic events.
Bitcoin Technical Analysis and ETF Flows
Bitcoin exchange-traded fund activity can also provide market context.
Spot Bitcoin ETFs create another channel through which investors can gain exposure to Bitcoin.
Changes in ETF flows can influence market sentiment and liquidity expectations.
Technical analysts may therefore consider ETF flows alongside price, volume, moving averages, and market structure.
However, ETF flows should not be interpreted as a standalone prediction of future Bitcoin prices.
Bitcoin On-Chain Analysis
Bitcoin on-chain analysis examines information recorded directly on the Bitcoin blockchain.
Analysts can study wallet activity, transaction flows, exchange balances, long-term holder behavior, and other blockchain metrics.
On-chain data can complement traditional technical analysis.
For example, price may be approaching resistance while on-chain data shows changes in holder behavior.
Combining these data sources can provide a broader understanding of market conditions.
Bitcoin Technical Analysis and Whale Activity
Large Bitcoin holders are often referred to as whales.
Large transfers can attract market attention because significant transactions may influence liquidity or sentiment.
However, a large wallet transfer does not automatically mean that the owner intends to sell.
Coins can move between wallets, custody providers, exchanges, and other addresses for many reasons.
Therefore, whale activity should be interpreted carefully rather than treated as a direct price prediction.
Bitcoin Volatility
Bitcoin volatility is an important consideration for anyone using technical analysis.
Large price movements can cause technical levels to break quickly.
A support level that appeared reliable during a low-volatility period may fail during a major market shock.
Volatility can also create false signals.
This is why traders often consider position sizing and risk management alongside their technical analysis.
Bitcoin Risk Management
Technical analysis cannot eliminate risk.
A trader can correctly identify a trend and still experience losses because the market unexpectedly reverses.
Bitcoin risk management may involve controlling position size, defining acceptable losses, avoiding excessive leverage, and understanding the potential impact of volatility.
Leverage deserves particular caution because it magnifies exposure.
A disciplined approach focuses not only on potential returns but also on how much capital could be lost if a technical setup fails.
Common Bitcoin Technical Analysis Mistakes
One common mistake is relying on a single indicator.
For example, a trader may see an oversold RSI reading and immediately assume that Bitcoin must rise.
Another mistake is ignoring higher timeframes.
Traders can also confuse a temporary breakout with a confirmed trend change.
Using too many indicators can create conflicting signals and make analysis unnecessarily complicated.
A simple framework based on market structure, support, resistance, volume, and a few carefully selected indicators can often be easier to interpret.
Bitcoin Technical Analysis vs Fundamental Analysis
Technical Analysis primarily examines price, volume, momentum, and market structure.
Fundamental Analysis focuses on factors such as Bitcoin’s network, adoption, economics, regulation, institutional demand, technology, and broader financial conditions.
These approaches answer different questions.
Technical analysis can help describe what the market is doing, while fundamental research can help explain why investors may value the asset differently over time.
Using both approaches can provide broader context.
Current Bitcoin Technical Picture
As of late September 2026, recent technical reporting has highlighted several important developments.
Bitcoin moved above its one-year average and was being watched around its 200-day average, according to CoinDesk. Earlier in September, BTC faced resistance around the $83,000 region, while a golden-cross formation became a major technical talking point.
Bitcoin subsequently moved through the $82,000 area during September, with analysts discussing whether continued spot demand could support the move.
At the same time, leverage and futures positioning remained an important consideration. A September 28 CoinDesk report noted that futures open interest had declined toward yearly lows while bearish positioning remained visible among some leveraged traders.
These observations illustrate why current Bitcoin Technical Analysis should be updated regularly rather than based on a single historical chart.
Future Bitcoin Technical Analysis
As cryptocurrency markets mature, Bitcoin Technical Analysis is likely to incorporate more data sources.
Traditional indicators may increasingly be combined with order-book information, derivatives data, ETF flows, on-chain metrics, liquidity measurements, and algorithmic analysis.
Artificial intelligence and machine-learning systems may also be used to identify patterns across large datasets.
Despite these developments, fundamental technical concepts such as trend, support, resistance, momentum, volume, and market structure are likely to remain important.
Conclusion
Bitcoin Technical Analysis provides a structured way to study Bitcoin price behavior using charts, indicators, volume, and market structure.
Important tools include support and resistance, moving averages, RSI, MACD, Fibonacci retracement, candlestick patterns, trendlines, and trading volume. These tools can help traders understand momentum and identify areas that deserve attention.
Recent September 2026 market activity demonstrates why technical analysis needs to remain flexible. Bitcoin has interacted with major resistance and long-term moving averages while golden-cross signals, macroeconomic conditions, ETF flows, and leverage have all influenced market discussions.
Technical indicators do not guarantee future price movements. Bitcoin can react unexpectedly to economic data, regulatory developments, liquidity changes, market sentiment, and major news.
For beginners, the most useful approach is to learn market structure first and then gradually add indicators such as moving averages, RSI, MACD, and volume. Combining technical analysis with risk management and broader market research can create a more balanced framework for studying Bitcoin.
Frequently Asked Questions
What is Bitcoin Technical Analysis?
Bitcoin Technical Analysis is the study of BTC price charts, volume, trends, momentum, and market structure to understand historical and current market behavior.
Which indicators are useful for Bitcoin Technical Analysis?
Popular indicators include moving averages, RSI, MACD, Fibonacci retracement, volume, Bollinger Bands, trendlines, and support and resistance.
What is Bitcoin support?
Bitcoin support is a price area where buying activity has historically helped slow or reverse downward price movement.
What is Bitcoin resistance?
Bitcoin resistance is a price area where selling pressure has historically limited upward price movement.
What is a Bitcoin golden cross?
A Bitcoin golden cross occurs when the 50-day moving average rises above the 200-day moving average. It is widely watched as a trend indicator, but it does not guarantee future gains.
Can Bitcoin Technical Analysis predict the future?
Technical analysis cannot predict Bitcoin’s future with certainty. It provides a framework for interpreting historical price behavior and current market conditions.
Is Bitcoin Technical Analysis useful for beginners?
Yes. Beginners can start with candlestick charts, market trends, support, Bitcoin Technical Analysis resistance, volume, and moving averages before learning more advanced indicators.