Hassan malik

Bitcoin Technical Analysis has become increasingly Bitcoin Technical Analysis important as BTC moves through a period of strong volatility in September 2026. Bitcoin recently climbed above $87,000 before retreating toward the $83,000 area, leaving traders focused on support, resistance, momentum indicators, moving averages and broader market structure.
The current market presents an interesting combination of strong institutional demand and short-term technical pressure. U.S. spot Bitcoin ETFs recorded approximately $2.4 billion in net inflows during the week ending September 25, their strongest weekly performance since October 2025. At the same time, Bitcoin has struggled to maintain the momentum that carried it above $87,000.
For traders and investors researching Bitcoin Technical Analysis, this situation demonstrates why a single indicator should not be used to understand BTC. Price action, trading volume, moving averages, RSI, MACD, support and resistance, ETF flows and macroeconomic conditions can all provide different pieces of information.
Technical analysis does not guarantee future price movements. Instead, it provides a framework for studying market behavior and identifying important areas where buying or selling pressure may change.
What Is Bitcoin Technical Analysis?
Bitcoin Technical Analysis is the process of examining BTC price charts and market data to understand trends, momentum and potential areas of support or resistance.
Unlike fundamental analysis, which focuses on adoption, network activity, regulation, supply and demand, technical analysis primarily studies historical price and volume behavior.
Traders commonly use moving averages, RSI, MACD, trendlines, Fibonacci retracement levels, support zones and resistance levels when analyzing Bitcoin.
Because Bitcoin trades 24 hours a day, its chart can change quickly. A technical level that appears important in the morning can be tested or broken later the same day.
This makes timeframes particularly important. A five-minute Bitcoin chart can show a very different structure from a daily or weekly chart.
Current Bitcoin Price Structure
Bitcoin’s recent price structure has been defined by a strong September recovery followed by a pullback.
According to IG, Bitcoin reached a September 21 high of approximately $87,402.34 before retreating toward the $83,000 region. Profit-taking and renewed pressure from higher Treasury yields were among the factors cited for the pullback.
CoinMarketCap’s September 28 analysis reported BTC around $82,927 and identified $82,570 as a nearby swing low, with $84,800 acting as an immediate resistance area.
This creates an important short-term technical range.
If Bitcoin holds its nearby support and recovers the immediate resistance area, traders may interpret that as evidence that buyers are still active. If support fails, attention may shift toward lower technical levels.
These are technical scenarios rather than guaranteed outcomes.
Bitcoin Support Levels
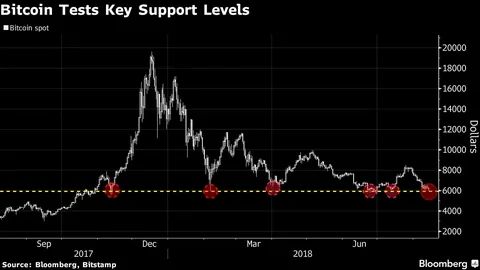
Bitcoin support levels are areas where buyers have previously shown enough interest to slow or reverse declines.
The current market has several areas attracting technical attention.
The $82,000–$83,000 region is particularly important because Bitcoin has recently traded around this area after retreating from above $87,000. DailyForex identified $80,000 as a major support level, while other current technical analyses have focused on the $82,000–$83,000 area as an immediate demand zone.
A deeper technical zone is located around the mid-to-high $70,000s. FXStreet’s analysis places the 50-day EMA near $77,292, with the 100-day and 200-day EMAs around $73,915 and $74,245 respectively.
These levels can change as new price data develops.
Bitcoin Resistance Levels
Bitcoin resistance represents price areas where selling pressure may increase.
The $85,000 area is currently an important short-term resistance zone. Bitcoin has struggled to sustain moves above this region after its recent rally.
The next major reference point is the September high around $87,400.
A sustained move above the recent high would change the short-term chart structure and potentially create a new resistance area as traders reassess price discovery.
However, simply moving above a resistance level during an intraday session does not necessarily confirm a breakout. Traders often look for a sustained close, stronger volume or additional confirmation.
Bitcoin Moving Averages
Moving averages are among the most widely used tools in Bitcoin Technical Analysis.
A moving average smooths price data over a specific period, making it easier to identify the broader direction of the market.
Shorter moving averages react more quickly to price changes, while longer moving averages provide information about broader trends.
Binance Research reported that Bitcoin recently reclaimed its 50-week moving average after a lengthy period below it. The September 20 weekly close above that moving average was the first such close since November 2025, according to its analysis.
This is technically significant because the 50-week moving average can act as a longer-term trend reference.
However, a moving-average reclaim is not a guaranteed signal. Binance Research specifically noted that Bitcoin needs to continue holding the level during future pullbacks for the recovery structure to gain stronger confirmation.
Bitcoin Golden Cross
Another important technical development is the Bitcoin golden cross.
A golden cross generally occurs when a shorter-term moving average crosses above a longer-term moving average.
Binance Research reported that Bitcoin formed a golden cross on September 8, 2026, when the 50-day moving average crossed above the 200-day moving average after spending 293 days below it.
Golden crosses are commonly interpreted as a trend-strength indicator, but they should not be treated as an automatic buy or sell signal.
Historical patterns can provide context, but every market cycle is different.
The most useful approach is to combine moving-average signals with price structure, volume, momentum and fundamental market conditions.
Bitcoin RSI Analysis
The Relative Strength Index, commonly called RSI, measures the speed and magnitude of recent price movements.
RSI is usually displayed on a scale from 0 to 100. Traders often use it to identify periods when momentum may have become unusually strong or weak.
Current readings show that Bitcoin’s momentum has cooled from its recent rally.
FXStreet reported an RSI around 58 on September 28, describing momentum as constructive but not overbought.
CoinMarketCap’s analysis, using a different market snapshot later in the session, reported an RSI around 38.
The difference highlights an important point: indicator readings can change rapidly depending on the exact time, exchange data and calculation method.
Therefore, RSI should be treated as a dynamic indicator rather than a fixed market signal.
Bitcoin MACD Analysis
The Moving Average Convergence Divergence, or MACD, is another popular momentum indicator.
MACD compares moving averages to help traders study momentum and potential changes in trend strength.
FXStreet reported that Bitcoin’s MACD remained marginally positive while momentum had cooled.
A positive MACD can indicate that shorter-term momentum remains above the longer-term trend, while a weakening MACD can suggest that upward momentum is losing strength.
MACD is most useful when compared with actual price structure.
For example, if Bitcoin rises while MACD momentum weakens, traders may watch for potential divergence. Conversely, if Bitcoin breaks resistance while MACD strengthens, it can provide additional confirmation of the move.
Bitcoin Trend Analysis
The broader Bitcoin trend has improved compared with the September lows.
Binance Research reported that Bitcoin recovered from a September low near $75,613 and subsequently moved above $86,000. The research described the technical picture as improved but requiring follow-through.
The recent weekly moving-average reclaim and golden cross are important components of this technical structure.
However, the current pullback means traders are watching whether Bitcoin can maintain its recently improved structure.
A market trend is stronger when higher highs and higher lows remain intact. If those structures break, traders may reassess the broader trend.
Bitcoin Trading Volume
Trading volume is an important confirmation tool in Bitcoin Technical Analysis.
Price movements with strong volume can indicate broad market participation. A breakout occurring with weak volume may be less convincing because fewer participants are supporting the move.
The recent Bitcoin rally occurred alongside significant institutional ETF demand. U.S. spot Bitcoin ETFs attracted approximately $2.4 billion during the week ending September 25.
ETF flows and spot trading volume are not identical measurements, but they can provide complementary information about market participation.
For technical traders, combining price, volume and ETF activity can provide a more complete picture than relying on price alone.
Bitcoin ETF Flows and Technical Analysis
One of the most interesting aspects of current Bitcoin Technical Analysis is the relationship between ETF demand and price behavior.
The U.S. spot Bitcoin ETFs recorded their strongest weekly inflow since October 2025, receiving approximately $2.4 billion during the week ending September 25.
Yet Bitcoin still pulled back from above $87,000 toward the $83,000 region.
This suggests that strong institutional demand does not automatically eliminate short-term selling pressure.
Technical traders can therefore monitor ETF flows as a fundamental confirmation factor while continuing to analyze the price chart independently.
Bitcoin Fibonacci Levels
Fibonacci retracement is another common tool used in cryptocurrency technical analysis.
Traders use Fibonacci ratios to identify potential retracement areas after significant price movements.
A retracement does not necessarily indicate that a trend has ended. Markets frequently move backward before continuing in the same direction.
CoinMarketCap’s September 28 analysis identified approximately $84,149 as the 38.2% Fibonacci retracement level and noted that reclaiming this level could provide useful confirmation for short-term recovery.
Fibonacci levels are best viewed as reference zones rather than exact price predictions.
Bitcoin Market Momentum
Bitcoin market momentum has slowed following the September rally.
BTC moved above $87,000 before sellers pushed the price back toward the low-$80,000s. Current technical indicators provide mixed information: some measures remain constructive while others show weakening short-term momentum.
This creates a market where confirmation becomes particularly important.
A recovery above nearby resistance with stronger volume could demonstrate renewed buying momentum. Conversely, a sustained break below major support could indicate that the correction is becoming deeper.
Bitcoin Macro Factors
Technical analysis does not exist independently from macroeconomic conditions.
Bitcoin’s recent pullback has occurred while U.S. Treasury yields remain elevated. Binance Research reported that the 10-year Treasury yield reached approximately 5.17%, while expectations for further tightening increased.
Higher yields can affect risk appetite across financial markets.
Bitcoin is increasingly connected to global financial conditions, so traders following BTC Technical Analysis often monitor Treasury yields, inflation data, Federal Reserve policy and broader liquidity.
The upcoming U.S. inflation and employment data are therefore relevant to the next phase of Bitcoin’s price structure.
Bitcoin Technical Outlook
The current Bitcoin Technical Outlook can be understood through several key areas.
The immediate region around $82,000–$83,000 is important because BTC has recently been testing this area. A stronger recovery would bring $84,800–$85,000 into focus as nearby resistance.
Above that, the September high around $87,400 remains a major reference point.
On the downside, $80,000 is an important psychological and technical area, while longer-term moving averages are positioned around the mid-$70,000s.
These levels describe the current chart structure rather than predicting what Bitcoin must do next.
Bitcoin Breakout Analysis
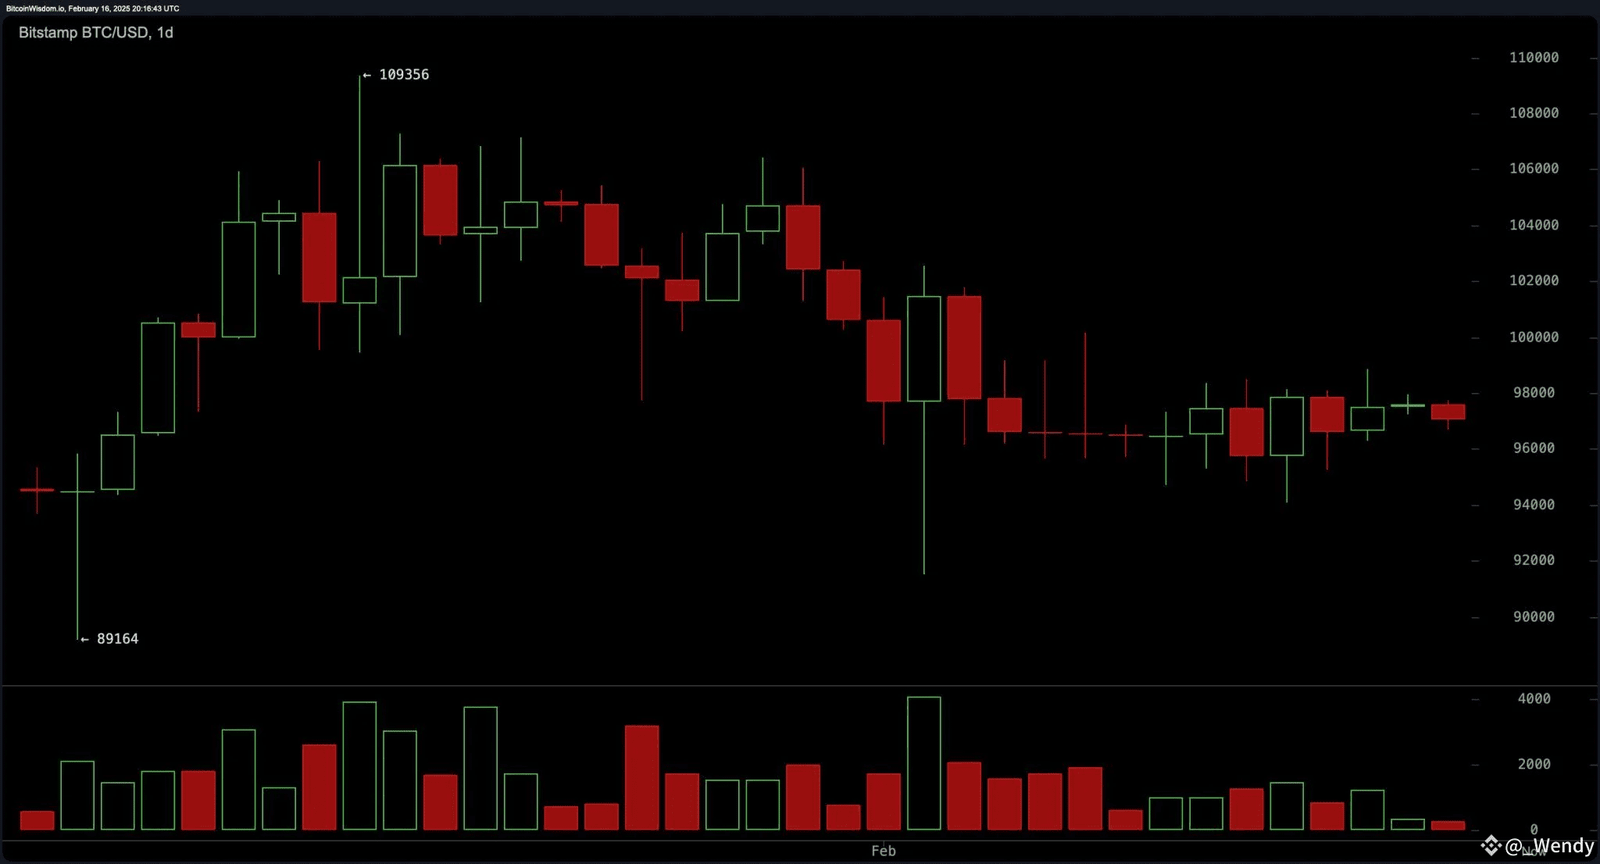
A Bitcoin breakout occurs when price moves decisively beyond an established support or resistance zone.
For a potential upside breakout, traders may watch the $85,000 area and then the September high near $87,400.
A convincing breakout typically receives additional attention when it is accompanied by stronger trading volume and sustained price acceptance above the level.
On the other hand, a failure to hold a breakout can produce a false-breakout pattern.
This is why experienced traders often wait for confirmation rather than reacting to a single intraday move.
Bitcoin Correction Analysis
A Bitcoin correction is a decline following a previous advance.
The current pullback from above $87,000 can be analyzed as a correction within the larger September recovery.
DailyForex reported that Bitcoin’s move toward approximately $82,800 left $80,000 as a major test for the durability of the recovery.
A correction does not automatically mean that the broader trend has reversed.
The key issue is whether Bitcoin can maintain important support levels and preserve its higher-high and higher-low structure.
Bitcoin Support and Resistance Strategy
Support and resistance can help traders organize their analysis.
Rather than treating a support or resistance level as an exact line, it can be more useful to think of it as a zone where market behavior may change.
For example, the $82,000–$83,000 region is currently an important area because BTC is trading near it after its recent rally.
The $85,000 area is another important zone because Bitcoin has recently struggled to maintain prices above it.
Using zones rather than exact points can help account for Bitcoin’s natural volatility.
Bitcoin Weekly Chart Analysis
The Bitcoin weekly chart provides a broader perspective than short-term charts.
Binance Research highlighted the importance of Bitcoin’s weekly close above its 50-week moving average. The September 20 weekly close marked the first close above that average since November 2025.
This development suggests that the broader technical structure has improved.
However, the next test is whether Bitcoin can continue holding above the moving average during future market pullbacks.
Weekly charts can help reduce the noise created by short-term price fluctuations and provide a clearer view of major trends.
Bitcoin Daily Chart Analysis
The Bitcoin daily chart currently shows a recovery that has entered a consolidation or correction phase.
BTC moved from the $75,000 region to above $87,000 before retreating toward $83,000.
Current technical indicators show that momentum has slowed, while the market remains sensitive to support around the low-$80,000s.
The daily chart is particularly useful for identifying short- and medium-term levels.
Traders can monitor whether Bitcoin forms higher lows, breaks resistance or loses major support.
Bitcoin Short-Term Technical Analysis
Short-term Bitcoin Technical Analysis currently focuses on the relationship between approximately $82,000–$83,000 support and the $84,800–$85,000 resistance region.
CoinMarketCap identified $82,570 as a recent swing low and approximately $84,800 as an immediate resistance area.
A recovery above resistance would change the immediate chart structure, while a sustained decline below support could bring lower levels into focus.
Short-term analysis should be updated frequently because Bitcoin’s price can change significantly within hours.
Bitcoin Long-Term Technical Structure
The long-term Bitcoin chart remains different from the short-term picture.
The recent reclaim of the 50-week moving average and the September golden cross represent improvements in the longer-term technical structure.
At the same time, Binance Research emphasizes that these signals require follow-through and are not infallible.
Long-term technical analysis therefore requires patience and a broader timeframe.
Weekly and monthly charts can help investors distinguish between temporary corrections and major changes in market structure.
Bitcoin Technical Analysis and Risk Management
Technical analysis is most useful when combined with risk management.
Bitcoin is a volatile asset, and even technically strong setups can fail.
Traders often define their risk before entering a position rather than deciding after a trade has moved against them.
Position sizing, stop-loss planning, leverage management and diversification can all affect the level of risk.
Technical indicators should therefore be used as analytical tools rather than guarantees of future performance.
Key Bitcoin Technical Indicators to Watch
Several indicators are especially relevant to the current Bitcoin market.
The 50-week moving average is important because Bitcoin recently reclaimed it. The 50-day and 200-day moving averages provide additional trend information, while RSI and MACD can help monitor momentum.
Support around $82,000–$83,000 and resistance near $85,000 and $87,400 are also important price references.
ETF flows provide another useful confirmation factor because recent institutional demand has been unusually strong.
What Could Change Bitcoin’s Technical Structure?
Several events could influence Bitcoin’s technical structure.
A sustained move above the September high could create a new price-discovery phase. Conversely, a break below major support could shift short-term momentum toward a deeper correction.
Macroeconomic releases can also produce sudden price changes. Binance Research highlighted upcoming inflation and employment data as important tests for the current recovery.
ETF flows are another important factor. Continued inflows could support demand, while a shift toward sustained outflows could change the market’s liquidity dynamics.
Conclusion
Bitcoin Technical Analysis currently shows a market that has improved from its September lows but is experiencing short-term pressure after reaching above $87,000.
The $82,000–$83,000 area is an important near-term support zone, while approximately $85,000 and the September high near $87,400 remain important resistance references.
From a broader perspective, Bitcoin recently reclaimed its 50-week moving average and formed a golden cross, two developments that have improved its longer-term technical structure. Binance Research emphasizes that continued price acceptance above the weekly moving average would provide stronger confirmation.
At the same time, strong ETF inflows have not prevented the recent correction. U.S. spot Bitcoin ETFs received approximately $2.4 billion in net inflows during the week ending September 25, demonstrating strong institutional demand even as BTC pulled back.
For anyone following Bitcoin Technical Analysis, the most useful approach is to combine price structure, support and resistance, moving averages, RSI, MACD, volume, ETF flows and macroeconomic conditions. Bitcoin remains highly volatile, and technical indicators describe market conditions rather than guaranteeing future price movements.
Frequently Asked Questions
What is Bitcoin Technical Analysis?
Bitcoin Technical Analysis is the study of BTC price charts, volume, momentum and technical indicators to understand market trends and important support and resistance areas.
What are the important Bitcoin support levels?
Current analysis is closely watching the $82,000–$83,000 region, with $80,000 also identified as an important broader support area.
What is Bitcoin’s major resistance level?
The $85,000 region is currently an important short-term resistance area, followed by the recent September high around $87,400.
Is Bitcoin above its moving averages?
Current analysis shows BTC above several shorter-term moving averages, while Binance Research reports that Bitcoin recently reclaimed its 50-week moving average.
What does Bitcoin RSI indicate?
Current RSI readings vary depending on the exact market snapshot and calculation time. Recent analyses have shown momentum ranging from constructive to more cautious, demonstrating that RSI can change quickly during volatile sessions.
Why are Bitcoin ETF flows important for technical analysis?
ETF flows provide additional information about institutional Bitcoin Technical Analysis demand. Recent U.S. spot Bitcoin ETFs recorded approximately $2.4 billion in weekly inflows, making ETF activity an important factor alongside technical price data.