Hassan malik
Technical Analysis is one of the most widely used methods for studying Technical Analysis financial markets, including Bitcoin, Ethereum, altcoins, stocks, forex, and other tradable assets. Instead of focusing primarily on news or a project’s underlying fundamentals, technical analysis examines historical price movements, trading volume, market structure, and indicators to understand how an asset has behaved and where important market levels may exist.
In the cryptocurrency market, Technical Analysis has become particularly popular because digital assets can experience substantial price movements within short periods. Bitcoin and other cryptocurrencies trade continuously, creating a large amount of price data that traders can analyze through different chart timeframes.
A technical trader may study support and resistance, moving averages, RSI, MACD, trendlines, candlestick patterns, volume, and momentum indicators. Each tool provides a different perspective, but none can guarantee what the market will do next.
Understanding Technical Analysis is therefore less about finding one perfect indicator and more about learning how different pieces of market information fit together. A strong understanding of chart structure can help traders recognize trends, identify important price zones, evaluate momentum, and manage risk more systematically.
What Is Technical Analysis?
Technical Analysis is a method of analyzing markets by studying historical price and volume data. The central idea is that market prices reflect the combined actions and expectations of buyers and sellers.
Technical analysts examine charts to identify patterns, trends, momentum, and recurring market behavior. They may compare current price action with previous market movements to understand how an asset is behaving.
In cryptocurrency markets, technical analysis is commonly applied to Bitcoin price, Ethereum, altcoins, and crypto trading pairs. Traders can use charts ranging from one-minute timeframes to weekly and monthly periods depending on their strategy.
Technical analysis does not provide certainty. Markets can react unexpectedly to economic announcements, regulations, exchange events, geopolitical developments, or sudden changes in investor sentiment. Technical tools are therefore best understood as analytical frameworks rather than prediction machines.
Why Technical Analysis Matters in Crypto

The cryptocurrency market is known for its volatility, which makes market timing and risk management important considerations for active traders.
Crypto Technical Analysis allows traders to organize price information into a structured framework. Instead of simply watching whether Bitcoin is rising or falling, a trader can examine whether the asset is making higher highs and higher lows, whether trading volume is increasing, and whether momentum indicators are strengthening or weakening.
Technical analysis can also help traders identify areas where the market has previously reacted. These areas may become potential support or resistance zones.
For example, if Bitcoin repeatedly finds buying interest around a particular price region, traders may monitor that region during future declines. Similarly, if sellers have repeatedly appeared near a particular level, that area may receive attention as resistance.
Understanding Price Charts
A price chart is the foundation of Technical Analysis.
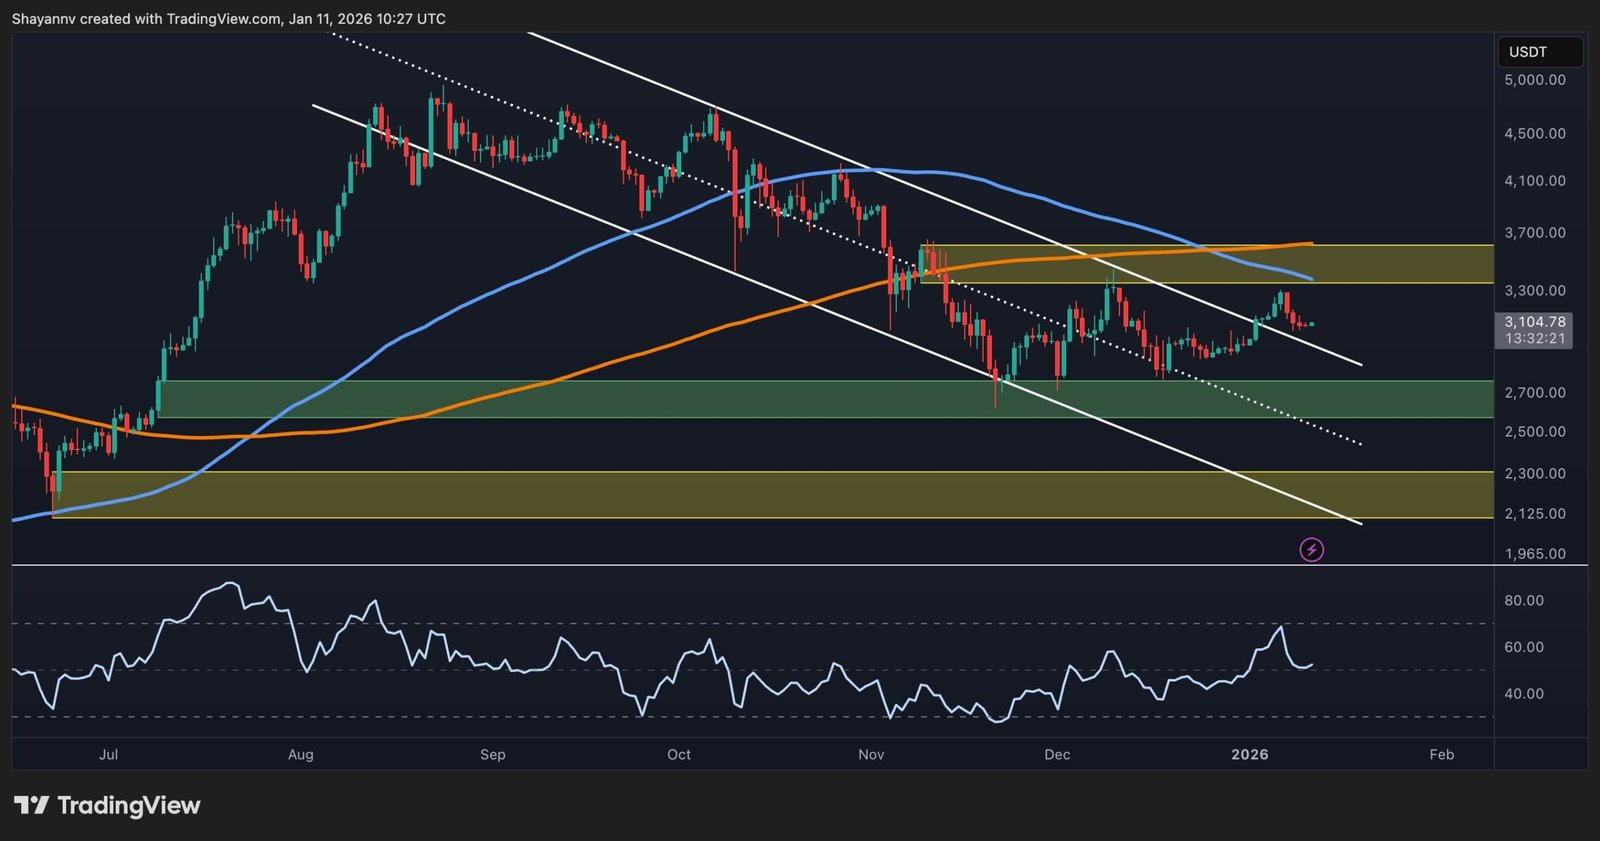
Charts display the historical movement of an asset over a selected timeframe. The most common chart types include line charts, bar charts, and candlestick charts.
Candlestick charts are particularly popular among cryptocurrency traders because they provide information about the opening price, closing price, highest price, and lowest price during a specific period.
A single candle can represent one minute, one hour, one day, or even one week depending on the selected timeframe.
When multiple candles are viewed together, traders can identify market structures and patterns that may be difficult to recognize from individual price points.
Candlestick Analysis
Candlestick analysis focuses on the shape, size, and position of individual candles and groups of candles.
A bullish candle generally indicates that the closing price was higher than the opening price, while a bearish candle indicates that the closing price was lower than the opening price.
The candle’s upper and lower shadows show the highest and lowest prices reached during that period.
Traders may study patterns such as engulfing candles, doji formations, hammer structures, and shooting stars. However, these patterns should be considered within their broader market context.
For example, a bullish candlestick pattern near established support may have a different meaning from the same pattern appearing in the middle of a strong downtrend.
Understanding Market Trends
Identifying the market trend is one of the most important parts of Technical Analysis.
An uptrend generally consists of a sequence of higher highs and higher lows. A downtrend is commonly characterized by lower highs and lower lows.
A sideways or range-bound market occurs when price moves between relatively defined support and resistance areas without establishing a clear directional trend.
Recognizing the current trend can help traders understand the broader market environment.
However, trends can change. An uptrend can transition into consolidation or a downtrend, while a downtrend can eventually form a recovery structure.
This is why traders continuously monitor price action rather than assuming that an existing trend will continue indefinitely.
Support and Resistance
Support and resistance are fundamental concepts in Technical Analysis.
Support refers to an area where buying interest has historically helped slow or stop declining prices. Resistance refers to an area where selling pressure has previously limited upward movement.
These levels are often better understood as zones rather than exact lines because cryptocurrency prices can move through a small range before reversing.
When resistance is broken and successfully retested, the previous resistance area can sometimes become support.
Likewise, if a support zone breaks decisively, traders may monitor that area as potential resistance during a later recovery.
Moving Averages
Moving averages are among the most widely used technical indicators.
A moving average calculates the average price over a specific number of periods. It smooths short-term fluctuations and can make broader market trends easier to identify.
The 20-day, 50-day, 100-day, and 200-day moving averages are commonly discussed in financial-market analysis.
Shorter moving averages respond more quickly to recent price changes, while longer moving averages react more slowly and are often used to study broader trends.
When the current market price remains above an important moving average, traders may interpret the broader structure differently than when price remains below it.
However, moving averages are lagging indicators because they are calculated from historical prices.
RSI in Technical Analysis
The Relative Strength Index, or RSI, is a momentum indicator used to measure the speed and magnitude of recent price movements.
RSI ranges from 0 to 100. Traders commonly monitor higher readings for strong upward momentum and lower readings for strong downward momentum.
Traditional Technical Analysis often considers RSI readings above 70 as potentially overbought and readings below 30 as potentially oversold. These levels are not automatic reversal signals.
A cryptocurrency can remain at elevated RSI levels during a strong uptrend, just as it can remain at lower levels during an extended decline.
Therefore, RSI is usually more useful when combined with price structure, support and resistance, and other indicators.
MACD Indicator
The Moving Average Convergence Divergence, commonly called MACD, is another popular momentum indicator.
MACD compares different moving averages to help traders understand changes in momentum and trend strength.
Traders often examine the MACD line, signal line, and histogram. Crossovers can indicate changes in momentum, while divergence between price and MACD can sometimes provide additional information.
For example, if an asset creates a new price high while MACD momentum fails to reach a corresponding high, traders may investigate whether momentum is weakening.
Like other indicators, MACD should not be interpreted in isolation.
Trading Volume Analysis
Trading volume measures how much of an asset is traded during a particular period.
Volume can provide important confirmation for price movements.
A price breakout accompanied by strong volume may indicate greater market participation than a breakout occurring with very low volume.
Similarly, unusually high volume during a major sell-off can provide information about the intensity of market activity.
Crypto traders often combine volume analysis with support and resistance to evaluate whether a price movement appears broadly supported by market participation.
Trendlines in Technical Analysis
Trendlines are simple lines drawn across important price points to visualize the direction of a market.
An ascending trendline can connect a series of higher lows, while a descending trendline can connect lower highs.
Trendlines can help traders identify whether price is maintaining a particular structure.
However, trendlines are subjective. Different traders may draw them slightly differently depending on which highs and lows they consider significant.
For this reason, trendlines are often combined with horizontal support and resistance levels.
Breakouts and Breakdowns
A breakout occurs when price moves above an important resistance area, while a breakdown occurs when price moves below significant support.
Breakouts can attract considerable attention because they may indicate a change in market structure.
However, not every breakout becomes a sustained trend.
A false breakout occurs when price moves beyond a key level but quickly returns inside the previous range.
Volume, closing prices, retests, and broader market momentum can help traders evaluate the strength of a breakout.
Retest Strategy
After breaking an important resistance level, an asset may return to test that area again. This is commonly called a retest.
If former resistance holds as new support, traders may view the price structure as stronger than if the asset immediately falls back below the level.
The same concept can work in reverse. When support breaks, price may later return to test the former support from below.
Retests are not guaranteed, and markets sometimes continue moving without returning to a broken level.
Fibonacci Retracement
Fibonacci retracement is a technical tool used to identify potential retracement zones following a significant price movement.
Common Fibonacci levels include 23.6%, 38.2%, 50%, 61.8%, and 78.6%.
Traders may use these levels to identify areas where a correction could potentially slow or where price might encounter resistance.
Fibonacci levels become more useful when they overlap with other technical structures such as previous support, resistance, moving averages, or trendlines.
They should not be treated as precise predictions.
Technical Analysis Timeframes
Choosing the right timeframe is essential.
Scalpers may focus on very short charts such as one-minute, five-minute, or fifteen-minute periods. Day traders may use hourly and four-hour charts, while swing traders often focus on four-hour and daily charts.
Long-term investors may concentrate more heavily on weekly and monthly charts.
A cryptocurrency can appear bullish on a five-minute chart while remaining bearish on a weekly chart. This is why multiple timeframe analysis can provide additional context.
Multiple Timeframe Analysis
Multiple timeframe analysis involves examining the same asset across different chart periods.
A trader might begin with a weekly chart to understand the broader trend, then move to a daily chart to identify major support and resistance, and finally use a shorter timeframe for more detailed price analysis.
This approach can help reduce the risk of interpreting a short-term movement without understanding the larger market structure.
The exact timeframes depend on the trader’s objectives and strategy.
Technical Analysis for Bitcoin
Bitcoin Technical Analysis is particularly popular because BTC has high trading activity and extensive historical price data.
Traders often monitor Bitcoin’s major support and resistance zones, moving averages, RSI, MACD, volume, market structure, and trendlines.
Bitcoin can also influence the broader cryptocurrency market. Major BTC movements can affect Ethereum and many altcoins, making Bitcoin analysis relevant beyond the BTC market itself.
However, Bitcoin remains highly volatile, and historical technical patterns do not guarantee future price behavior.
Technical Analysis for Ethereum
Ethereum Technical Analysis uses many of the same concepts as Bitcoin analysis.
Traders can examine ETH support and resistance, moving averages, RSI, MACD, volume, trendlines, and candlestick formations.
Ethereum’s market can also respond to network developments, decentralized finance activity, institutional products, and broader crypto-market sentiment.
Combining chart analysis with relevant fundamental information can provide a broader understanding of ETH market conditions.
Technical Analysis for Altcoins
Altcoin Technical Analysis can be more challenging because many smaller cryptocurrencies have lower liquidity and shorter trading histories.
Lower liquidity can contribute to larger price movements and wider spreads.
Technical indicators can still be useful, but traders should consider liquidity, trading volume, token supply, market capitalization, exchange availability, and project-specific developments.
An indicator that works reasonably well on a highly liquid asset may behave differently on a smaller cryptocurrency.
Technical Analysis and Market Psychology
Although Technical Analysis focuses on price data, market psychology plays an important role in why chart patterns can develop.
Markets are influenced by fear, greed, uncertainty, optimism, and expectations.
When many traders expect a resistance level to hold, selling pressure may increase around that area. When traders expect a breakout, buying activity may increase.
This collective behavior can contribute to recognizable price structures.
Understanding psychology can therefore complement technical indicators.
Technical Analysis and Risk Management
Technical analysis should be combined with risk management.
Even a technically attractive setup can fail because unexpected news or market volatility can quickly change conditions.
Traders may use position sizing, stop-loss orders, risk-to-reward calculations, and diversification to control potential losses.
Risk management is especially important in cryptocurrency markets because leverage can significantly increase both potential gains and losses.
A technical setup should therefore be viewed as one component of a broader trading plan.
Common Technical Analysis Mistakes
One common mistake is relying on a single indicator.
For example, seeing an RSI reading below 30 does not automatically mean that a cryptocurrency must rise. An asset can remain oversold during a strong downtrend.
Another mistake is ignoring the broader timeframe.
A short-term bullish signal may occur inside a longer-term downtrend.
Traders can also make mistakes by entering immediately after a breakout without waiting for confirmation.
Learning to combine multiple forms of evidence can reduce dependence on any single signal.
Technical Analysis vs Fundamental Analysis
Technical Analysis and fundamental analysis approach markets differently.
Technical analysis focuses primarily on price, volume, momentum, and market structure.
Fundamental analysis considers factors such as technology, adoption, financial performance, economic conditions, tokenomics, regulation, network activity, and development.
Neither approach needs to completely replace the other.
Many market participants use technical analysis to understand price structure while using fundamental information to understand why an asset may have long-term demand.
Crypto Technical Analysis Tools
Modern traders have access to many crypto analysis tools.
Charting platforms can provide candlestick charts, technical indicators, drawing tools, volume data, and multiple timeframes.
On-chain analytics platforms can provide information about blockchain activity, wallet movements, exchange balances, and network statistics.
Market-data platforms can provide prices, trading volume, market capitalization, derivatives information, and other metrics.
The most useful tool depends on the trader’s specific research needs.
How Beginners Can Learn Technical Analysis
Beginners should start with the basics rather than attempting to learn dozens of indicators at once.
Understanding candlesticks, trends, support, resistance, volume, and moving averages provides a foundation for more advanced concepts.
After learning these basics, beginners can explore RSI, MACD, Fibonacci retracement, chart patterns, and multiple timeframe analysis.
Practicing on historical charts can also help develop chart-reading skills without immediately exposing capital to market risk.
A trading journal can be useful for recording why a particular setup was identified and what happened afterward.
Technical Analysis and Cryptocurrency Volatility
Cryptocurrency volatility makes technical analysis both interesting and challenging.
Bitcoin and altcoins can move rapidly after economic announcements, regulatory news, exchange developments, ETF flows, or changes in market sentiment.
During highly volatile periods, traditional support and resistance levels can be broken quickly.
This is why traders need to account for the possibility that technical structures can fail.
The Future of Technical Analysis
Technical Analysis continues to evolve as financial markets become more data-driven.
Modern traders increasingly combine traditional chart indicators with algorithmic models, order-flow information, on-chain data, derivatives metrics, and real-time market data.
Artificial intelligence and machine-learning systems are also being explored for pattern recognition and market research.
Despite these developments, the core principles of price, volume, liquidity, trend, and market structure remain central to technical analysis.
Conclusion
Technical Analysis provides a structured way to study cryptocurrency and financial markets using price, volume, momentum, trends, and market structure.
Tools such as support and resistance, moving averages, RSI, MACD, Fibonacci retracement, trendlines, candlestick patterns, and volume analysis can help traders organize market information.
However, no indicator can guarantee future price movements. Cryptocurrency markets can react unexpectedly to economic data, regulation, liquidity changes, market sentiment, and major news events.
The most useful approach is to combine multiple forms of evidence and maintain disciplined risk management. Beginners can start with basic chart concepts before gradually learning more advanced indicators and strategies.
As the crypto industry continues to develop, Technical Analysis is likely to remain an important research method for traders studying Bitcoin, Ethereum, altcoins, and broader digital-asset markets.
Frequently Asked Questions
What is Technical Analysis?
Technical Analysis is a method of studying historical price and volume data to identify trends, momentum, support, resistance, and potential market structures.
Which indicators are commonly used in Technical Analysis?
Popular indicators include moving averages, RSI, MACD, Bollinger Bands, Fibonacci retracement, volume indicators, and trendlines.
Is Technical Analysis accurate?
Technical Analysis can help organize market information, but it cannot guarantee future price movements. Unexpected news and changing market conditions can invalidate technical setups.
What is support and resistance?
Support is a price zone where buying interest may help slow a decline, while resistance is an area where selling pressure may limit an upward movement.
Can beginners learn Technical Analysis?
Yes. Beginners can start by learning candlestick charts, trends, support, resistance, volume, and moving averages before progressing to more advanced indicators.
Is Technical Analysis useful for Bitcoin?
Yes. Bitcoin’s extensive trading history and high market activity Technical Analysis make it one of the most commonly analyzed cryptocurrencies using technical-analysis methods.