Hassan malik
Technical analysis is one of the most widely used methods for studying Technical Analysis financial markets. Whether you are interested in stocks, cryptocurrencies, forex, commodities, or indices, technical analysis provides a structured way to examine historical price and trading-volume data. Instead of focusing primarily on a company’s financial statements or economic conditions, technical analysts concentrate on what price has done and what that behavior may suggest about potential future market movements.
At its core, technical analysis is based on the study of price charts, market trends, trading volume, and recurring patterns. Traders use these tools to identify areas where buying or selling interest may increase, recognize changes in momentum, and establish potential entry and exit levels. However, technical analysis is not a crystal ball. Historical patterns can provide useful information, but they cannot guarantee what will happen next.
Modern technical analysis combines traditional chart-reading techniques with Technical Analysis sophisticated indicators and computer-based analysis. Traders may examine moving averages, the Relative Strength Index, MACD, Bollinger Bands, candlestick formations, trendlines, and volume. The objective is generally to organize market information into a framework that can help with decision-making.
Understanding technical analysis requires more than memorizing indicators. Successful chart analysis involves understanding market structure, recognizing trends, interpreting momentum, managing risk, and knowing when a signal may be unreliable. This guide explores the major concepts of technical analysis and explains how they fit together.
What Is Technical Analysis?
Technical analysis is the study of historical market data, particularly price and volume, to identify patterns and trends. Analysts use charts and mathematical indicators to evaluate how an asset has behaved over a specific period.
The central idea behind technical analysis is that market prices reflect the collective actions of buyers and sellers. Because investor behavior can sometimes repeat under similar circumstances, analysts attempt to identify recurring formations and market conditions.
A technical analyst may examine whether an asset is making higher highs and higher lows, which can indicate an upward trend. Conversely, lower highs and lower lows may indicate downward market structure. When neither pattern dominates, the asset may be trading within a range.
Technical analysis is commonly used for short-term trading, swing trading, and longer-term market analysis. The timeframe can range from minutes and hours to weeks, months, or even years.
Why Technical Analysis Matters
Technical analysis can help traders organize large amounts of market information. A price chart can reveal changes in momentum, volatility, and market structure that may be difficult to identify from raw price data alone.
One important advantage is that technical analysis can be applied to many different markets. The same fundamental concepts of support and resistance, trends, momentum, and volume can be used across stocks, currencies, commodities, and digital assets.
Another important feature is flexibility. Some traders use simple price action and trendlines, while others rely on several technical indicators. There is no universal combination that works in every market environment.
Technical analysis can also help establish predefined levels for managing risk. For example, a trader may identify an area where a market thesis would become invalid and use that information when determining a potential stop-loss level.
However, technical analysis should be viewed as an analytical framework rather than a guarantee of future performance. Unexpected news, economic developments, liquidity changes, and market sentiment can cause prices to behave differently from historical patterns.
Understanding Price Charts
Price charts are the foundation of technical analysis. They display how an asset’s price changes over time and allow analysts to identify trends, patterns, and important levels.
Line Charts
A line chart connects closing prices over a selected period. It provides a Technical Analysis simple view of the overall direction of a market and can be useful for identifying broad trends.
Because it contains less information than other chart types, a line chart is often easier for beginners to understand. However, it does not display the complete range of price activity within each period.
Bar Charts
Bar charts provide information about the opening price, highest price, lowest price, and closing price for each period. This gives traders more information about price behavior than a basic line chart.
The relationship between the opening and closing prices can help analysts understand whether buyers or sellers dominated a particular period.
Candlestick Charts
Candlestick charts are among the most popular tools used in technical analysis. Each candle displays the open, high, low, and close for a specific timeframe.
Candlesticks can reveal market psychology through their body size and Technical Analysis upper and lower wicks. A long candle may indicate strong movement, while a small body can suggest uncertainty or reduced momentum.
Individual candlesticks can also form recognizable patterns. Examples include doji formations, engulfing patterns, hammer-style formations, and shooting-star formations. These patterns are generally interpreted in the context of the surrounding trend rather than in isolation.
Market Trends and Market Structure
Identifying the prevailing trend is one of the most important parts of technical analysis. A market can generally be described as trending upward, trending downward, or moving sideways.
Uptrends
An uptrend typically consists of a sequence of higher highs and higher lows. This structure suggests that buyers are generally maintaining control over the market.
Traders may use trendlines, moving averages, and previous swing points to study an upward trend. However, an uptrend can experience temporary pullbacks without necessarily becoming a downtrend.
Downtrends
A downtrend is generally characterized by lower highs and lower lows. This structure indicates sustained selling pressure relative to buying pressure.
Technical analysts may monitor whether price continues to respect descending resistance areas or whether it breaks above important swing highs.
Sideways Markets
A sideways market occurs when price moves within a relatively defined range Technical Analysis without establishing a strong upward or downward trend.
These conditions can create repeated interactions with support and resistance levels. Some traders use range-based strategies in such environments, although breakouts can occur unexpectedly.
Support and Resistance
Support and resistance are fundamental concepts in technical analysis.
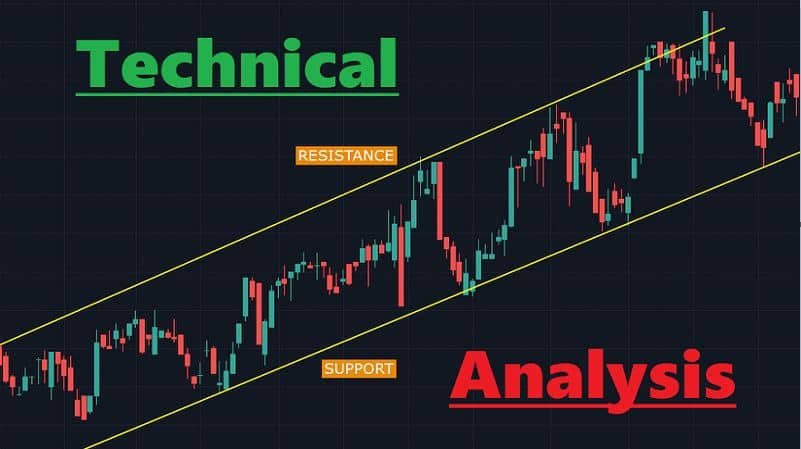
Support refers to a price area where buying interest has historically appeared strongly enough to slow or reverse a decline. Resistance refers to a price area where selling pressure has previously limited upward movement.
These levels are not necessarily exact prices. They are often better understood as zones where market participants may react.
How Support Works
When an asset repeatedly finds buyers around a particular area, traders may identify that region as support. If price approaches the same area again, market participants may watch closely for signs of buying activity.
However, support can fail. A decisive break below support may indicate a change in market structure or an increase in selling pressure.
How Resistance Works
Resistance develops when an asset repeatedly struggles to move beyond a particular area. Traders may interpret repeated rejection near that level as evidence that sellers are active.
If price eventually moves above resistance with strong momentum or volume, analysts may examine whether the former resistance area becomes new support.
Technical Indicators
Technical indicators are mathematical calculations based primarily on price, volume, or both. They can help analysts measure momentum, trend direction, volatility, and market strength.
Indicators should generally complement price analysis rather than replace it. Using too many indicators can also create conflicting signals.
Moving Averages
Moving averages smooth historical price data to make trends easier to identify. Common examples include the Simple Moving Average and Exponential Moving Average.
A moving average can help traders understand whether prices are generally moving above or below a longer-term trend reference. Shorter moving averages tend to respond more quickly to recent price changes, while longer averages react more slowly.
Some traders watch for moving-average crossovers. A short-term average crossing above or below a longer-term average may be interpreted as a potential change in momentum, although such signals can produce false indications.
Relative Strength Index
The Relative Strength Index (RSI) is a momentum oscillator designed to measure the speed and magnitude of recent price movements.
RSI is often displayed on a scale from 0 to 100. Traders commonly monitor higher and lower zones to identify conditions where momentum may have become unusually strong.
However, an asset remaining at a high RSI level does not automatically mean its price must fall. Likewise, a low RSI does not guarantee that price will rise. RSI signals are more meaningful when considered alongside trend, support, resistance, and broader market conditions.
MACD
The Moving Average Convergence Divergence (MACD) indicator compares moving averages to help analyze momentum and trend changes.
Traders often examine the MACD line, signal line, and histogram. Changes in the relationship between these components can provide information about strengthening or weakening momentum.
MACD can be particularly useful when combined with price structure because an indicator signal occurring near an important support or resistance area may provide additional context.
Bollinger Bands
Bollinger Bands are designed to measure price volatility around a moving average. They consist of a central moving average and upper and lower bands that adjust according to volatility.
When volatility increases, the bands generally expand. When volatility decreases, they tend to contract.
A period of narrowing bands is sometimes described as a volatility squeeze. Traders may watch such conditions because a substantial price movement can follow periods of unusually low volatility, although the direction of the eventual movement cannot be guaranteed by the bands alone.
Candlestick Patterns and Price Action
Price action trading focuses primarily on the movement of price rather than relying heavily on technical indicators.
Candlestick formations can provide information about buying and selling pressure. For example, a candle with a long upper wick may show that buyers pushed price higher during the period but sellers subsequently drove it lower.
The meaning of a candlestick depends heavily on context. A bullish-looking candle near established support may have a different interpretation from the same candle appearing in the middle of a strong downtrend.
This is why professional chart analysis generally avoids treating individual candlestick patterns as automatic buy or sell signals.
Chart Patterns
Chart patterns are recurring price structures that technical analysts use to study possible changes or continuations in market direction.
Head and Shoulders
The head and shoulders pattern is commonly associated with a possible transition from an upward trend toward a downward movement. It consists of three major peaks, with the middle peak higher than the surrounding peaks.
An inverse head and shoulders pattern has the opposite structure and is often studied during downtrends.
The pattern becomes more meaningful when its structure develops around important market levels and is confirmed by subsequent price behavior.
Double Tops and Bottoms
A double top occurs when price approaches a similar high twice and fails to establish a sustained move above it. Analysts may interpret this as evidence that resistance remains significant.
A double bottom involves two similar lows and may indicate that selling pressure is weakening if price subsequently moves higher.
Neither formation should be treated as a guaranteed reversal signal. Confirmation and market context remain important.
Triangles and Consolidation Patterns
Triangles develop when price moves within converging trendlines. Common types include ascending, descending, and symmetrical triangles.
These formations represent a period in which the market becomes increasingly compressed. Traders often monitor the eventual breakout, while recognizing that false breakouts can occur.
Trading Volume in Technical Analysis
Trading volume measures how much of an asset changes hands during a particular period. Volume can provide additional context for price movements.
A price increase accompanied by strong volume may indicate greater participation than the same price increase occurring on unusually low volume. Similarly, a sharp price decline accompanied by elevated volume may indicate significant selling activity.
Volume is particularly useful when examining breakouts. A move beyond a major resistance level accompanied by increased trading activity may receive more attention from technical analysts than a breakout occurring on weak volume.
Volume interpretation varies across markets, however. Spot markets, decentralized cryptocurrency markets, and centralized exchanges may have different data-quality considerations.
Technical Analysis and Risk Management
Technical analysis cannot eliminate market risk. One of the most important applications of technical analysis is therefore understanding where an analysis may be invalidated.
Risk management involves determining how much capital to expose to an individual trade and how to respond if the market moves against the original thesis.
Stop-loss orders are one commonly used risk-management mechanism. Position sizing is another. Instead of concentrating a large portion of capital in one position, traders may limit exposure according to their personal risk tolerance and strategy.
A technically attractive chart can still produce a losing trade. Good risk management recognizes this possibility before a position is entered.
Common Technical Analysis Mistakes
Beginners often make the mistake of adding too many indicators to a single chart. A screen filled with oscillators, moving averages, and signals may appear sophisticated but can make analysis more confusing.
Another common mistake is treating technical indicators as predictions rather than analytical tools. Indicators are derived from historical data, so they cannot know future events.
Ignoring the larger timeframe can also create problems. A short-term bullish signal may occur while a larger timeframe remains in a strong downtrend. Examining multiple timeframes can provide broader context.
Emotional decision-making is another major challenge. Fear, greed, impatience, and the desire to recover losses quickly can interfere with an objective trading process.
Combining Technical Analysis With Other Information
Technical analysis does not have to exist independently from other forms of market research. Many market participants combine chart analysis with fundamental analysis, economic data, company information, or broader market conditions.
For example, a stock chart may show a bullish technical setup, while upcoming economic data could create significant uncertainty. A cryptocurrency chart may indicate strong momentum while regulatory or industry developments introduce additional risk.
Combining different sources of information can create a broader analytical framework. The important point is to understand what each method can and cannot tell you.
Technical Analysis in Cryptocurrency Markets

Cryptocurrency markets have become a major area for technical analysis. Bitcoin, Ethereum, and other digital assets frequently experience significant price movements and changing volatility.
Crypto traders commonly use support and resistance, moving averages, RSI, MACD, Fibonacci retracement levels, candlestick patterns, and volume analysis.
However, cryptocurrency markets have characteristics that can affect technical analysis. They operate around the clock, liquidity can vary substantially between exchanges, and market sentiment can change rapidly.
Because of this volatility, technical signals in cryptocurrency markets can fail quickly. Traders may therefore pay particular attention to position sizing and risk management.
Technical Analysis in Forex and Stock Markets
Technical analysis is also widely used in forex and equity markets. Forex traders often analyze currency pairs across multiple timeframes and may incorporate economic calendars alongside chart patterns.
Stock traders may combine technical analysis with earnings information, company announcements, sector performance, and broader economic conditions.
Although the markets differ, the basic principles of chart analysis remain similar. Price structure, momentum, volatility, volume where available, and important price levels can all contribute to market analysis.
How to Build a Technical Analysis Routine
A consistent technical analysis process can help reduce impulsive decisions. The first stage is usually identifying the market and timeframe being analyzed.
Next, traders can examine the broader trend and major support and resistance zones. After establishing market structure, they can consider whether momentum and volatility indicators provide additional information.
The final stage is risk assessment. Before taking any action, it is important to consider what could invalidate the analysis and how much exposure is appropriate.
Keeping a trading journal can also be useful. Recording the reasoning behind an analysis allows traders to review previous decisions and identify recurring mistakes or strengths in their process.
The Future of Technical Analysis
Technology continues to change how technical analysis is performed. Charting platforms now provide automated pattern recognition, advanced indicators, real-time data, and algorithmic trading capabilities.
Artificial intelligence and machine learning are also being incorporated into financial research and market-data analysis. These technologies can process enormous amounts of information, but they do not remove uncertainty from financial markets.
The fundamental principles of technical analysis remain relevant because price, volume, market structure, and investor behavior continue to generate observable data.
The future will likely involve greater integration between traditional chart analysis, quantitative models, and automated systems rather than the complete replacement of one approach by another.
Conclusion
Technical analysis provides a framework for studying market behavior through price charts, volume, trends, patterns, and indicators. From support and resistance to moving averages, RSI, MACD, candlestick patterns, and chart formations, these tools can help traders organize market information and develop structured analytical processes.
The most important lesson is that technical analysis is not a guaranteed forecasting system. A pattern that worked previously may fail under different market conditions, and even strong technical signals can be disrupted by unexpected events.
For that reason, technical analysis works best when it is combined with disciplined risk management, realistic expectations, and careful consideration of broader market conditions. Learning to read charts is only one part of becoming a better market analyst. Understanding uncertainty and managing risk are equally important.
Whether applied to stocks, forex, commodities, or cryptocurrency, Technical Analysis technical analysis can provide valuable insight into how markets have behaved and how traders are responding to changing conditions. With practice, patience, and a consistent analytical process, technical analysis can become a useful component of a broader approach to understanding financial markets.