Hassan malik
Technical analysis is one of the most widely used methods for Technical Analysis studying financial markets, including cryptocurrency. Instead of focusing primarily on a project’s business model or underlying technology, technical analysis examines historical price movements, trading volume, market structure, and chart behavior to identify potential trends and market setups.
The cryptocurrency market is particularly interesting for technical analysis because it operates 24 hours a day, seven days a week. Bitcoin, Ethereum, Solana, XRP, and thousands of other digital assets continuously generate new price and volume data. This creates a large amount of information for traders and analysts to study, while the market’s volatility can also produce frequent technical signals.
Modern crypto technical analysis goes beyond simply identifying whether a chart is going up or down. Analysts can study support and resistance, moving averages, momentum, volatility, trading volume, market structure, and derivatives data. Binance’s 2026 educational guide identifies support and resistance, moving averages, RSI, MACD, and Bollinger Bands among commonly used technical-analysis tools, while also noting that indicators can produce false signals.
Recent cryptocurrency markets also demonstrate how technical analysis is applied in real time. In September 2026, Reuters described Bitcoin’s movement through several major moving averages following a sharp rally, while separate analysis of Ethereum identified a breakout from a bull-flag formation. These examples show how analysts combine price action, chart patterns, moving averages, and important price levels rather than relying on one indicator alone.
This guide explains the foundations of technical analysis, the most important indicators, chart patterns, volume analysis, crypto-specific metrics, and the limitations that traders should understand when interpreting charts.
What Is Technical Analysis?
Technical analysis is a method of analyzing historical market data to identify trends, momentum, volatility, and potential future market scenarios. The main assumption is that information about market activity is reflected in price and volume behavior.
Rather than asking whether a cryptocurrency is fundamentally valuable, technical analysis asks questions such as whether price is trending upward, whether momentum is strengthening, where buyers and sellers have previously appeared, and whether a breakout has meaningful volume behind it.
Technical Analysis vs. Fundamental Analysis
Technical and fundamental analysis approach markets from different perspectives.
Fundamental analysis focuses on factors such as technology, adoption, revenue, network activity, tokenomics, competition, and development. Technical analysis concentrates primarily on price action, volume, market structure, and chart behavior.
Neither approach needs to replace the other. A market participant can study the fundamentals of a cryptocurrency while also using technical analysis to understand its current market structure.
Crypto Market Structure
Market structure is one of the most important foundations of technical analysis. Before adding indicators to a chart, analysts can first determine whether the market is trending upward, trending downward, or moving sideways.
An upward trend commonly consists of higher highs and higher lows. A downward trend is characterized by lower highs and lower lows. A sideways or ranging market occurs when price repeatedly moves between relatively defined areas without establishing a clear directional trend.
Higher Highs and Higher Lows
When buyers consistently push price above previous highs and defend higher lows, the chart can develop a bullish structure.
This does not guarantee that the trend will continue. A market can change direction after breaking an important swing low or failing to establish another higher high.
Lower Highs and Lower Lows
A sequence of lower highs and lower lows generally indicates weakening price structure.
For example, if Bitcoin repeatedly fails to reclaim previous highs and subsequently falls below important swing lows, technical analysts may view the structure as increasingly bearish. However, confirmation generally requires examining the broader timeframe, volume, and other market conditions.
Support and Resistance
Support and resistance are among the most recognizable concepts in technical analysis.
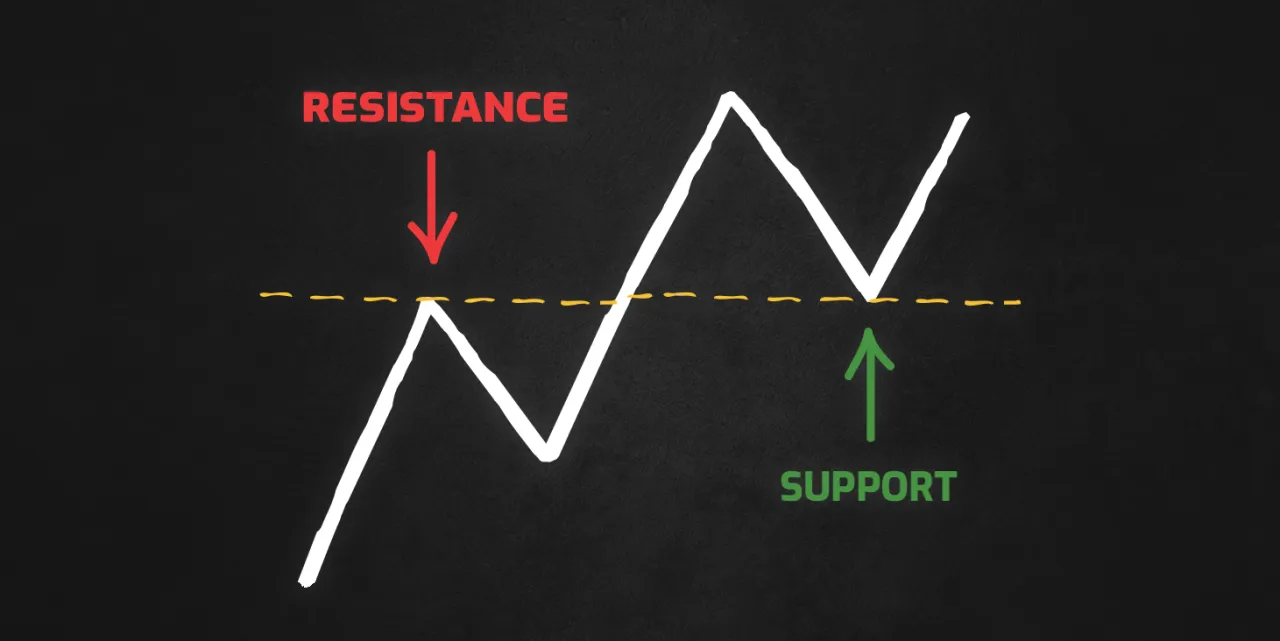
Support refers to an area where buying interest has previously appeared, while resistance describes an area where selling pressure has historically become stronger.
These levels are better understood as zones rather than perfectly precise numbers. Price can temporarily move through a level before returning, creating what traders often call a false breakout.
Support and Resistance in Crypto
Cryptocurrency markets can react strongly around widely observed price areas. Traders may watch previous highs, previous lows, psychological numbers, moving averages, and areas of high trading activity.
When resistance is convincingly broken, that former resistance can sometimes become a new support area. This is known as role reversal.
Similarly, if price falls through established support, the same region can later act as resistance during a recovery attempt.
Moving Averages
Moving averages are among the most commonly used technical indicators. They smooth historical price data, making it easier to observe broader trends.
A Simple Moving Average (SMA) gives equal weighting to prices within its selected period. An Exponential Moving Average (EMA) gives greater weight to more recent prices and therefore reacts more quickly to recent market movements.
Commonly observed periods include 20, 50, 100, and 200 periods, although there is no universal setting that works perfectly for every market or timeframe.
Golden Cross and Death Cross
A golden cross occurs when a shorter-term moving average crosses above a longer-term moving average. A death cross occurs when the shorter-term average crosses below the longer-term average.
These formations can provide information about changing momentum, but they are based on historical data and can lag behind actual price movements.
Reuters highlighted this concept in its September 2026 Bitcoin analysis, noting that Bitcoin had moved above its 21-, 55-, 100-, and 200-day moving averages during a major rally.
Relative Strength Index
The Relative Strength Index (RSI) is a momentum oscillator that measures the strength and speed of recent price movements. It moves between 0 and 100.
Traditional technical analysis often considers readings above 70 as overbought and readings below 30 as oversold. However, these thresholds should not automatically be interpreted as instructions to sell or buy.
In a strong uptrend, an asset can remain above 70 for an extended period. Likewise, an asset in a strong downtrend can remain below 30.
RSI Divergence
RSI divergence occurs when price and the RSI indicator move in different directions.
For example, price may establish a new high while RSI fails to reach a corresponding new high. Some analysts interpret this as a possible sign of weakening momentum.
Divergence can be useful as a warning signal, but it does not guarantee a reversal. Confirmation from price structure and other evidence remains important.
MACD Indicator
The Moving Average Convergence Divergence (MACD) indicator is another widely used momentum and trend-following tool.
MACD compares moving averages to identify changes in momentum. Traders commonly observe the MACD line, signal line, and histogram.
A bullish crossover can indicate increasing upward momentum, while a bearish crossover can indicate weakening momentum. However, MACD can produce multiple false signals during sideways markets.
For this reason, MACD often becomes more useful when combined with market structure and broader trend analysis.
Bollinger Bands
Bollinger Bands consist of a moving average accompanied by upper and lower bands based on price volatility.
When the bands narrow, market volatility is contracting. When they expand, volatility is increasing.
Bollinger Band Squeeze
A Bollinger Band squeeze occurs when the bands become unusually narrow. Traders often watch these periods because compressed volatility can eventually be followed by a larger price movement.
However, the squeeze itself does not identify whether the next major move will be upward or downward. Direction generally requires confirmation through price action, volume, and market structure.
Volume Analysis
Trading volume shows how much of an asset has changed hands during a particular period. Volume can help analysts understand the strength behind price movements.
A price breakout accompanied by increased volume can provide stronger confirmation than a breakout occurring with extremely low participation.
Price and Volume Relationship
Suppose a cryptocurrency rises above resistance while trading volume expands significantly. This may indicate that more participants are involved in the move.
On the other hand, if price continues rising while volume steadily declines, analysts may investigate whether participation is weakening.
Volume should not be interpreted as proof of future direction. It works best when combined with price action, support and resistance, and market structure.
VWAP and Volume Profile
Volume Weighted Average Price (VWAP) measures the average traded price over a specific period while giving greater importance to prices associated with greater volume.
VWAP is particularly common in intraday analysis. Traders may use it to understand whether current prices are above or below the session’s volume-weighted average.
Volume Profile provides a different perspective by showing where trading activity was concentrated across different price levels.
Important areas can include the Point of Control (POC), high-volume nodes, and low-volume nodes. These areas can help analysts understand where substantial market participation previously occurred.
Fibonacci Retracement
Fibonacci retracement is another popular technical-analysis tool. It is used to identify potential areas where a price correction might pause or where buyers and sellers may become active.
Common Fibonacci levels include 23.6%, 38.2%, 50%, 61.8%, and 78.6%.
The 61.8% level receives particular attention in many charting systems. Reuters referenced the 61.8% Fibonacci retracement level when discussing Bitcoin’s September 2026 technical structure.
Fibonacci levels are not guaranteed support or resistance. Their usefulness depends on market context and whether other technical factors support the same area.
Crypto Chart Patterns
Chart patterns are formations that appear through price movement over time. They are commonly divided into continuation and reversal patterns.
Patterns can help traders organize price behavior, but the shape of a chart should never be considered a guaranteed forecast.
Bull Flag Pattern
A bull flag generally develops after a strong upward movement followed by a period of consolidation.
In September 2026, Reuters reported that Ethereum had broken above the upper boundary of a bull-flag formation after consolidating following a major August rally. The analysis identified $2,661.52 as a key previous high and described the breakout as a technical development rather than a guaranteed outcome.
This example illustrates how technical analysts combine chart formations with important price levels and moving averages.
Double Top and Double Bottom
A double top forms when price approaches a similar high twice but fails to establish a sustained breakout. It can indicate resistance and potentially weakening momentum.
A double bottom develops when price tests a similar low twice and finds buying interest around that region.
Neither pattern is complete until relevant price levels are broken or confirmed according to the analyst’s methodology.
Breakouts and False Breakouts
A breakout occurs when price moves beyond an established support, resistance, trendline, or chart pattern boundary.
Breakouts can attract traders because they may represent a change in market structure. However, not every breakout develops into a sustained trend.
A false breakout occurs when price moves beyond an important level but then quickly returns inside the previous range.
How Volume Helps Confirm Breakouts
Volume can provide additional context when evaluating breakouts.
If price moves above resistance and trading volume increases, the breakout may have stronger participation than a move occurring on unusually low volume. Analysts may also wait for a candle close above the level or a subsequent retest before considering the breakout confirmed.
This does not eliminate risk. Markets can still reverse after apparently strong breakouts.
Multiple Timeframe Analysis
Multiple timeframe analysis involves examining the same cryptocurrency across different chart periods.
A daily chart may reveal the broader market structure, while a four-hour or one-hour chart can provide more detail about intermediate movements. Shorter timeframes can reveal even smaller price fluctuations.
Using multiple timeframes can help prevent traders from interpreting a short-term move as a major trend reversal.
For example, an asset might be bullish on a weekly chart but temporarily bearish on a one-hour chart. Both observations can be correct because they describe different time horizons.
Crypto Derivatives and Technical Analysis
Modern crypto technical analysis increasingly includes derivatives data. Futures and perpetual markets can provide information about leverage and trader positioning.
Two commonly observed metrics are open interest and funding rates.
Open interest represents the amount of outstanding derivatives contracts. Changes in open interest alongside price can provide additional context about market participation.
Funding rates show periodic payments between long and short positions in perpetual futures markets. Extremely positive or negative funding can indicate that one side of the market is heavily positioned, although it should not automatically be interpreted as a reversal signal.
Modern technical-analysis approaches increasingly combine these metrics with price, volume, and market structure.
Technical Analysis During Bull and Bear Markets
Technical indicators can behave differently depending on the market environment.
During a strong bull market, momentum indicators such as RSI may remain elevated for long periods. Selling simply because RSI is above 70 can therefore cause traders to exit a strong trend prematurely.
During a bear market, the opposite problem can occur. Oversold readings can remain oversold while price continues falling.
Sideways markets create another challenge because moving-average crossover systems can generate repeated signals as price moves back and forth across the averages.
This is why identifying the broader market regime is an important part of technical analysis.
Common Technical Analysis Mistakes
One common mistake is using too many indicators. Adding RSI, MACD, several moving averages, Bollinger Bands, and multiple oscillators does not necessarily create better analysis.
Another mistake is treating indicators as guaranteed prediction tools. Every technical setup can fail.
Traders can also make errors by ignoring timeframe differences. A bullish five-minute chart does not necessarily mean that the daily trend is bullish.
Another problem is ignoring liquidity and volatility. A pattern that appears reliable on Bitcoin may behave differently on a thinly traded altcoin.
Risk Management and Technical Analysis
Risk management is an essential part of using technical analysis. A chart setup may appear technically attractive and still fail.
Analysts often define an invalidation level before entering a trade. This establishes the price condition under which the original technical idea would no longer be considered valid.
Position sizing can also help manage exposure. Highly volatile cryptocurrencies may require different position sizes from assets with deeper liquidity and lower historical volatility.
Technical analysis should therefore be viewed as a framework for managing uncertainty rather than a system that eliminates uncertainty.
Limitations of Technical Analysis
Technical analysis has important limitations. Historical price patterns do not guarantee future results, and market conditions can change unexpectedly.
Unexpected regulatory announcements, exchange problems, security incidents, macroeconomic events, large liquidations, and sudden changes in liquidity can invalidate an otherwise convincing chart setup.
Binance’s 2026 technical-analysis guide specifically notes that indicators can produce false signals, particularly in low-liquidity markets and shorter timeframes.
Technical analysis is therefore most useful when its signals are treated as probabilities and scenarios rather than certainties.
How to Build a Technical Analysis Process

A structured process can make chart analysis more consistent.
The first step is identifying the broader market structure. Determine whether the asset is trending upward, trending downward, or ranging.
Next, identify major support and resistance zones. After that, examine momentum using tools such as RSI or MACD if they answer a specific question.
Moving averages can provide additional trend context, while volume can help evaluate the strength of breakouts and reversals.
Finally, consider volatility, liquidity, and derivatives information where relevant. The goal is not to collect the largest number of indicators but to build a coherent explanation of current market behavior.
Conclusion
Technical analysis provides a structured way to study cryptocurrency markets through price action, market structure, volume, momentum, volatility, and chart patterns.
The most important concepts include support and resistance, moving averages, RSI, MACD, Bollinger Bands, Fibonacci retracement, volume analysis, VWAP, and chart patterns. More advanced crypto analysis can also incorporate open interest, funding rates, and volume-profile data.
Recent Bitcoin and Ethereum market movements demonstrate how these concepts are applied in real-world markets. Reuters’ September 2026 reports examined Bitcoin’s relationship with multiple moving averages and Ethereum’s breakout from a bull-flag formation, while emphasizing that technical analysis does not guarantee future price movements.
The most useful approach is to treat technical analysis as a framework for understanding market behavior rather than a guaranteed prediction system. Combining price structure with carefully selected indicators, volume, multiple timeframes, and appropriate risk management can provide a more complete view of cryptocurrency markets.
Frequently Asked Questions
What is technical analysis?
Technical analysis is the study of historical price and volume data to identify market trends, momentum, volatility, support, resistance, and potential trading setups.
Which technical indicators are most commonly used?
Common indicators include moving averages, RSI, MACD, Bollinger Bands, VWAP, Fibonacci retracement, and volume-based tools.
Is technical analysis accurate for cryptocurrency?
Technical analysis can help identify market patterns and scenarios, but it cannot guarantee future price movements. Cryptocurrency volatility and unexpected events can cause technical setups to fail.
What is support and resistance?
Support is an area where buying interest has historically appeared, while resistance is an area where selling pressure has previously become stronger.
Why is volume important in technical analysis?
Volume provides information about market Technical Analysis participation. Increasing volume during a breakout can provide additional confirmation, while weak volume can indicate limited participation. Volume should be interpreted together with price structure and other market information.