Hassan malik
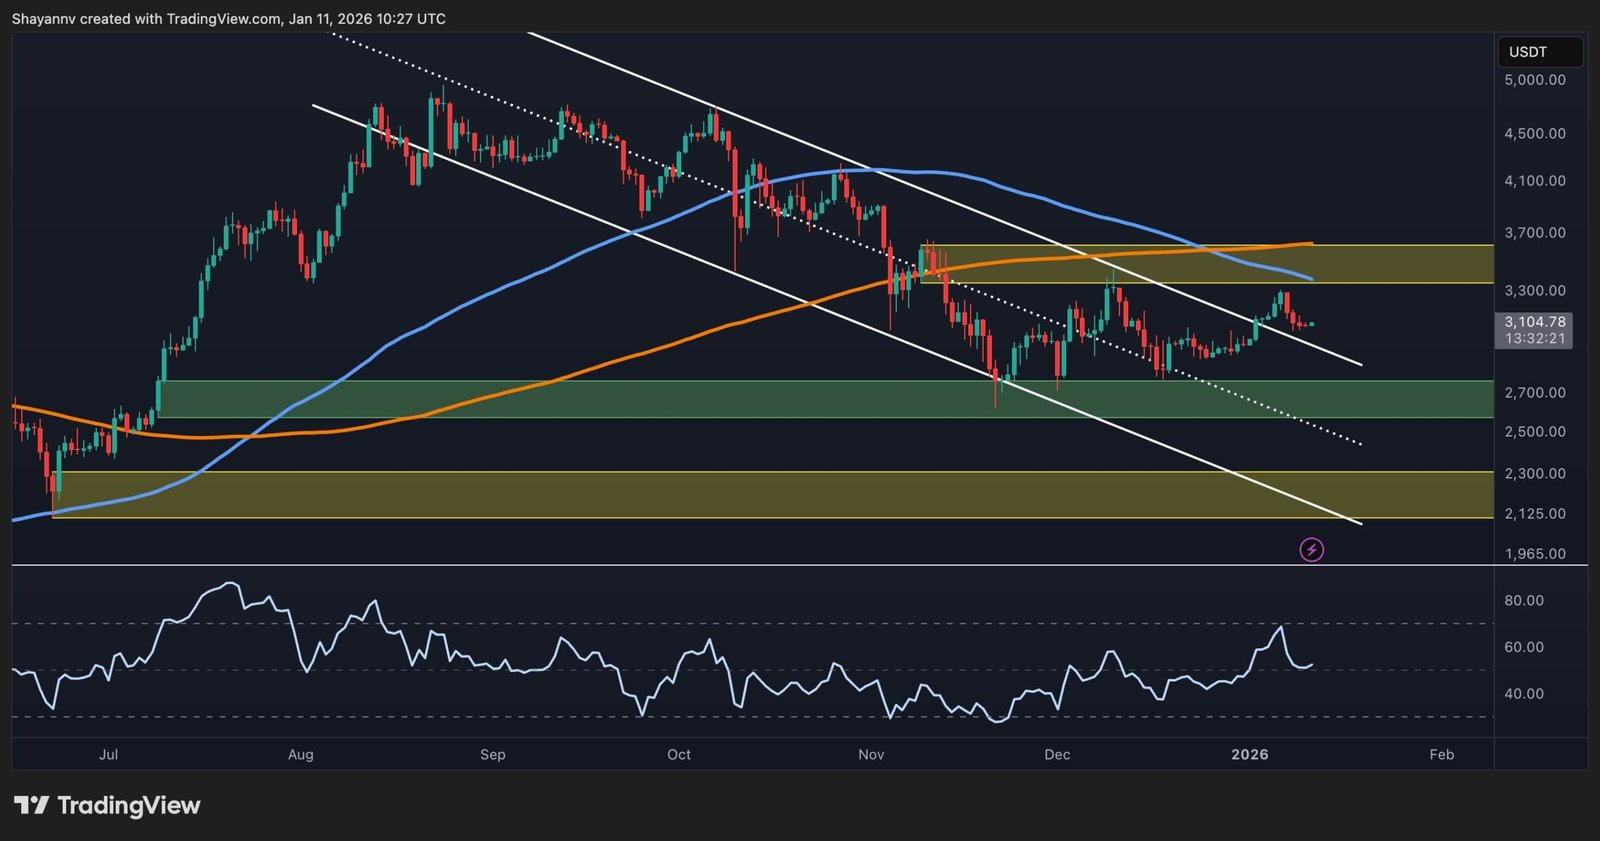
Ethereum remains one of the most important blockchain networks in the Ethereum Analysis cryptocurrency market, and its native asset, Ether (ETH), continues to attract attention from traders, investors, developers, and institutions. Unlike cryptocurrencies designed primarily around digital payments, Ethereum provides a programmable blockchain infrastructure that supports smart contracts, decentralized applications, decentralized finance, tokenization, and many other blockchain-based services.
For anyone researching Ethereum Analysis, looking at the ETH price alone is not enough. A broader analysis considers price structure, technical indicators, support and resistance, trading volume, institutional flows, network development, macroeconomic conditions, and overall cryptocurrency market sentiment.
As of September 28, 2026, ETH is trading around the mid-$2,600s. CoinMarketCap reported ETH at approximately $2,664.20 on September 28, with price pressure following a rejection from the $2,722–$2,822 supply area. The same analysis identified approximately $2,635 as a near-term swing-low reference and $2,500 as a potential lower support area.
Recent market data also shows that Ethereum has experienced a substantial recovery during September. Reuters reported on September 22 that ETH had broken above a bull-flag formation and the $2,661.52 level, while technical analysis at the time identified $2,775–$2,825 as an important area to watch.
This article provides a detailed Ethereum Analysis covering ETH price trends, technical indicators, important levels, ETF activity, Ethereum’s network fundamentals, macroeconomic factors, risks, and the key developments that could influence the market.
Ethereum Price Trends in September 2026
September has been an active month for Ethereum. ETH entered the month after a strong late-August rally and subsequently moved through several important technical levels.
Reuters reported that Ether had already gained more than 30% during its late-August rally before consolidating during the following weeks. The cryptocurrency then broke above the September 11 high of approximately $2,661.52, which represented an important technical level.
The breakout pushed Ethereum toward the upper-$2,000 range, with traders watching the $2,750–$2,825 region as an important resistance area.
By September 28, Ethereum had pulled back toward approximately $2,664. CoinMarketCap attributed the latest weakness partly to a broader cryptocurrency-market correction, a derivatives liquidation event, and rejection from the $2,722–$2,822 supply zone.
This movement highlights an important principle of ETH price analysis: strong rallies can be followed by periods of consolidation or correction without necessarily changing the broader market structure immediately.
Ethereum Technical Analysis
ETH Market Structure
Market structure is a fundamental part of Ethereum technical analysis.
Traders study whether ETH is creating higher highs and higher lows or lower highs and lower lows. An extended sequence of higher highs and higher lows generally indicates an upward market structure, while lower highs and lower lows indicate downward pressure.
Recent Ethereum price action has included a recovery from lower levels followed by a move above previous resistance. Reuters described the September breakout as a move beyond a bull-flag formation, with the $2,661.52 level serving as a significant technical reference.
However, short-term structure has become more mixed following the pullback from the $2,700–$2,800 region. CoinMarketCap reported that ETH was trading between approximately $2,635 and $2,700 on September 28, making those levels important for near-term analysis.
Ethereum Moving Averages
Moving averages help traders smooth short-term price fluctuations and identify broader trends.
Recent technical data from CoinLore showed ETH trading above its 50-period and 200-period exponential moving averages on the daily timeframe. Its September 28 analysis listed the 50-period and 200-period EMA structure as supportive of the broader upward trend.
Moving averages should not be treated as automatic buy or sell signals. They are calculated from historical prices and can respond more slowly than the market itself.
For Ethereum Analysis, moving averages are most useful when considered alongside market structure, volume, support and resistance, and momentum indicators.
Ethereum Support and Resistance Levels

Support and resistance are among the most important concepts in ETH technical analysis.
Support describes a price area where buying interest has previously appeared, while resistance describes an area where sellers have previously limited upward movement.
Current market data places several important levels around Ethereum.
CoinMarketCap identified approximately $2,635 as a near-term swing-low reference, with $2,700 representing immediate resistance. The same analysis suggested that a sustained move below $2,635 could expose ETH to the $2,500 area.
CoinLore’s September 28 technical data listed approximately $2,633 as a support level, followed by lower levels around $2,368 and $2,312. Its resistance levels included approximately $2,715, $2,816, and $2,873.
These levels should be considered reference zones rather than guaranteed reversal points.
Ethereum’s $2,750–$2,800 Resistance Zone
The $2,750–$2,800 area has attracted considerable attention in recent Ethereum market analysis.
Cryptocurrency market reports identified this region as a major supply or resistance zone after ETH’s September recovery. ETH recently traded near $2,675 after failing to sustain a move through the upper part of this area.
A sustained move above resistance can change market structure, while repeated rejection can lead to consolidation or a deeper retracement.
The important point for Ethereum price analysis is that resistance is not an exact wall. Price can temporarily move above or below a zone before establishing a clearer direction.
Ethereum RSI and Momentum
The Relative Strength Index, or RSI, is a momentum indicator frequently used in crypto analysis.
RSI ranges from 0 to 100 and measures the magnitude of recent price movements. Traditional technical analysis often treats readings above 70 as potentially overbought and readings below 30 as potentially oversold.
Recent CoinLore data showed ETH’s daily RSI around 63.21 on September 28, placing it below the traditional 70 threshold while still indicating relatively strong recent momentum.
Another September 28 market analysis from TradingKey reported an RSI near 59.8 and described momentum conditions as neutral.
Differences between these readings can occur because indicators vary depending on data sources, timeframes, and calculation methods.
RSI should therefore be interpreted as one component of Ethereum technical analysis, not as an independent prediction tool.
Ethereum MACD Analysis
The Moving Average Convergence Divergence, or MACD, is another commonly used momentum indicator.
MACD compares moving averages to identify changes in momentum and possible shifts in trend behavior.
TradingKey’s September 28 ETH analysis reported a MACD value of approximately -10.51 and characterized the indicator as neutral.
CoinLore’s daily data, using a different calculation and dataset, showed MACD above its signal line while still characterizing the broader momentum picture as mixed.
This difference demonstrates why traders should avoid relying on a single indicator or a single data source. Timeframe and methodology can materially change technical readings.
Ethereum Trading Volume
Trading volume provides context for price movements by showing the level of market activity associated with a move.
When ETH breaks through an important resistance area with strong volume, traders may consider the move more significant than a breakout occurring during extremely thin activity.
Volume can also help identify potential exhaustion. A price increase accompanied by weakening participation may require closer examination.
For ETH market analysis, volume should be studied together with price structure, liquidity, derivatives activity, and broader market conditions.
Ethereum ETF Flows
U.S. spot Ethereum ETFs have become an increasingly important part of the ETH market.
ETF flows can provide information about institutional and traditional-market demand for Ethereum exposure through regulated investment products.
SatoshiMacro, using data from Farside Investors with SoSoValue as a fallback, reported that U.S. spot Ether ETFs recorded approximately $87 million of net inflows on September 25, led by ETHA and ETHB.
Other market reporting noted that Ethereum’s recent rally had been accompanied by multiple consecutive ETF inflow sessions.
However, daily ETF flows can fluctuate significantly. One positive or negative session should not be treated as definitive evidence of a long-term trend.
Ethereum Institutional Demand
Institutional participation has become increasingly relevant to Ethereum Analysis.
Spot ETFs create a regulated market structure through which traditional investors can obtain exposure to ETH without directly managing a blockchain wallet.
Institutional demand can influence market liquidity and sentiment, but it is only one part of the market. Retail activity, derivatives positioning, on-chain activity, network usage, macroeconomic conditions, and broader cryptocurrency sentiment can also influence ETH.
This means ETF flows are best viewed as one piece of the larger Ethereum market picture.
Ethereum Network Fundamentals
Price analysis is only one side of understanding Ethereum.
Ethereum’s underlying blockchain supports smart contracts and decentralized applications. Its ecosystem includes decentralized finance, stablecoins, tokenized assets, non-fungible tokens, layer-2 networks, and other blockchain applications.
Network development can therefore affect long-term perceptions of Ethereum.
A cryptocurrency’s price can move independently of short-term network fundamentals, especially during periods of strong speculation or broader market volatility. Nevertheless, network usage and technological development remain important for understanding Ethereum beyond its price chart.
Ethereum and Layer-2 Networks
Layer-2 networks are an important part of Ethereum’s broader ecosystem.
These networks are designed to process transactions or applications in ways that can reduce congestion and improve scalability while maintaining a connection to Ethereum’s underlying infrastructure.
The growth of layer-2 activity can affect how users interact with Ethereum and how transactions are distributed across the broader ecosystem.
For Ethereum fundamental analysis, understanding layer-2 development is therefore increasingly important.
Ethereum Upgrades and Development
Ethereum continues to evolve through protocol upgrades and development work.
Recent market coverage has highlighted upcoming development milestones, including the Glamsterdam upgrade process. A September 28 report noted that the Sepolia test network was scheduled for a Glamsterdam fork on October 6.
Protocol upgrades can affect scalability, network efficiency, developer activity, and the overall user experience.
However, an upgrade announcement does not automatically translate into a specific ETH price movement. Market expectations, implementation details, broader economic conditions, and actual adoption all matter.
Ethereum and Decentralized Finance
Ethereum remains closely associated with decentralized finance, commonly known as DeFi.
DeFi applications use smart contracts to provide functions such as decentralized trading, lending, borrowing, and liquidity provision.
The size and activity of Ethereum’s DeFi ecosystem can provide insight into demand for blockchain infrastructure.
However, DeFi also introduces risks, including smart-contract vulnerabilities, liquidity issues, market volatility, and regulatory uncertainty.
For Ethereum investors and researchers, DeFi activity is therefore an important fundamental metric but not a standalone valuation tool.
Ethereum and Stablecoins
Stablecoins represent another major part of the Ethereum ecosystem.
Many stablecoins operate on Ethereum or use Ethereum-compatible infrastructure. They are used in trading, decentralized applications, payments, liquidity management, and other blockchain activities.
Stablecoin activity can therefore influence demand for Ethereum-based infrastructure.
At the same time, stablecoin regulation and competition between different blockchain networks can affect the distribution of activity across the industry.
Ethereum and Macroeconomic Conditions
Ethereum does not trade independently from the broader financial system.
Interest-rate expectations, inflation, Treasury yields, liquidity, equity-market conditions, and investor risk appetite can all affect cryptocurrency markets.
Recent ETH weakness has occurred alongside broader risk-off pressure. CoinMarketCap reported that Ethereum’s September 28 decline was closely linked to a broader cryptocurrency-market pullback led by Bitcoin.
TradingKey also pointed to elevated Treasury yields and cautious monetary-policy expectations as factors limiting risk appetite.
This demonstrates why Ethereum market analysis should incorporate macroeconomic context rather than focusing exclusively on chart indicators.
Ethereum and Bitcoin Correlation
Ethereum frequently responds to Bitcoin’s market direction.
When Bitcoin experiences a major rally or sell-off, Ethereum and other major cryptocurrencies can react in the same direction.
CoinMarketCap reported that ETH’s September 28 decline was closely associated with Bitcoin’s decline and broader market weakness.
However, Ethereum can also experience periods of independent strength or weakness because of Ethereum-specific developments, ETF flows, network activity, and sector rotation.
Monitoring both BTC and ETH can therefore provide broader market context.
Ethereum On-Chain Analysis
On-chain analysis examines information recorded directly on blockchain networks.
For Ethereum, analysts can examine wallet activity, transaction activity, exchange flows, staking, decentralized application usage, and other blockchain metrics.
On-chain data can provide information that is not visible through a traditional price chart.
However, on-chain indicators require careful interpretation. A rise in wallet activity, for example, does not automatically indicate bullish or bearish price behavior. Different types of activity can have different meanings.
Combining on-chain information with technical and fundamental analysis can provide a broader view of the Ethereum ecosystem.
Ethereum Staking
Ethereum uses a proof-of-stake consensus system, and staking is a significant part of the network’s security model.
Users can participate in Ethereum staking directly or through various services and protocols, subject to the technical and financial conditions of the chosen method.
Staking can reduce the amount of ETH immediately available for trading, although the relationship between staking activity and market price is complex.
For Ethereum fundamental analysis, staking is therefore an important metric to monitor alongside network activity and supply dynamics.
Ethereum Supply and Burn Mechanism

Ethereum’s supply dynamics differ from Bitcoin’s fixed maximum supply model.
Ethereum’s supply can be influenced by issuance to validators and the burning of transaction fees under the network’s fee mechanism.
During periods of high network activity, fee burning can increase, while lower activity can produce different supply dynamics.
This means Ethereum supply analysis requires attention to both issuance and burned ETH rather than focusing on a single fixed supply number.
Risks in Ethereum Analysis
Ethereum remains a volatile digital asset, and several risks can affect its price.
Market-wide cryptocurrency corrections can cause ETH to decline rapidly. Regulatory developments can influence exchanges, ETFs, decentralized finance, and other parts of the ecosystem.
Ethereum also faces technological risks, competition from other smart-contract networks, smart-contract vulnerabilities, and changing market preferences.
Technical indicators can also produce false signals. A breakout may fail, support can break unexpectedly, and momentum indicators can remain elevated or depressed longer than anticipated.
For these reasons, Ethereum risk management is an important part of any serious market analysis.
What to Watch in Ethereum’s Market
Several factors deserve attention as Ethereum enters the final days of September 2026.
Technically, traders can monitor whether ETH holds the approximately $2,635 region and whether it can recover the $2,700 area. The $2,750–$2,800 zone remains an important resistance region based on recent market analysis.
ETF flows are another important factor. Continued inflows could provide information about institutional demand, while persistent outflows could indicate weaker demand through these products.
Macroeconomic data is also important. CoinMarketCap identified the September 30 U.S. PCE inflation report as a key event for the broader risk-asset environment.
Ethereum’s upcoming network developments and broader layer-2 ecosystem are additional fundamental factors worth monitoring.
Ethereum Analysis for Beginners
Beginners do not need dozens of indicators to start studying Ethereum.
A simple framework can begin with the ETH price chart, major support and resistance levels, overall trend, trading volume, and one or two momentum indicators.
After developing a basic understanding, users can explore moving averages, RSI, MACD, Fibonacci levels, market structure, on-chain metrics, ETF flows, and fundamental Ethereum developments.
The most important principle is to understand what each metric actually measures.
A technical indicator does not know the future. It summarizes historical data. Fundamental metrics also do not guarantee a particular price outcome.
A disciplined approach treats analysis as a way to understand market conditions rather than as a guarantee of what ETH will do next.
Final Thoughts on Ethereum Analysis
Current Ethereum Analysis shows a market balancing between strong recent recovery momentum and short-term resistance.
ETH broke above the $2,661.52 level in September after forming a bull-flag structure, according to Reuters, while the subsequent rally brought the cryptocurrency toward the $2,750–$2,800 region.
By September 28, ETH had pulled back toward approximately $2,664, with technical analysis identifying the $2,635 area as an important near-term support reference and $2,700 as immediate resistance.
At the same time, spot Ethereum ETF flows have remained an important part of the market story, with approximately $87 million of net U.S. spot Ether ETF inflows reported for September 25.
The broader Ethereum picture therefore includes several interconnected factors: ETH price action, technical indicators, ETF demand, Ethereum network development, staking, DeFi activity, layer-2 adoption, macroeconomic conditions, and cryptocurrency market sentiment.
Rather than relying on a single Ethereum price prediction, monitoring these different categories can provide a more complete understanding of the market. Ethereum remains a highly volatile asset, and historical technical patterns or fundamental developments cannot guarantee future price movements.
Frequently Asked Questions
What is Ethereum Analysis?
Ethereum Analysis is the process of studying ETH price movements, technical indicators, market structure, trading volume, ETF flows, on-chain activity, network development, and macroeconomic factors that may affect Ethereum.
What is Ethereum’s current price?
On September 28, 2026, Ethereum was trading around the mid-$2,600s. CoinMarketCap reported approximately $2,664.20 at the time of its September 28 analysis. Cryptocurrency prices change continuously.
What are important Ethereum support levels?
Recent market analysis identified approximately $2,635–$2,633 as an important near-term support area. Lower technical levels identified by different market sources include approximately $2,500 and $2,368.
What are Ethereum’s key resistance levels?
Recent analysis has focused on $2,700 as an immediate resistance area and approximately $2,750–$2,800 as a broader resistance or supply zone.
What factors affect Ethereum’s price?
ETH can be affected by cryptocurrency market conditions, Bitcoin’s performance, ETF flows, Ethereum network activity, staking, DeFi usage, protocol developments, liquidity, interest rates, inflation expectations, and investor sentiment.
Is Ethereum Analysis accurate?
Ethereum Analysis can help organize market information and identify possible Ethereum Analysis scenarios, but it cannot guarantee future price movements. Technical indicators and market fundamentals can change quickly, particularly during periods of high cryptocurrency volatility.