Hassan malik

Bitcoin remains the most closely watched digital asset in the cryptocurrency market, and Bitcoin Analysis understanding its price movement requires more than looking at a single chart. A useful Bitcoin Analysis combines technical indicators, market structure, trading volume, institutional activity, macroeconomic conditions, investor sentiment, and blockchain data. These factors can interact in different ways, which is why Bitcoin can sometimes rise despite negative headlines or decline even when long-term fundamentals appear strong.
As of late September 2026, Bitcoin is again attracting significant attention after a sharp recovery from earlier 2026 weakness. Recent market reports put BTC around the mid-$80,000s, with Bitcoin recently reaching an eight-month high above $86,000. MarketWatch reported that Bitcoin climbed more than 7% during a broader technology-market rally, while other reports highlighted strong U.S. spot Bitcoin ETF activity and renewed institutional participation.
At the same time, the market remains sensitive to interest rates, Treasury yields, regulation, liquidity, derivatives positioning, and changes in investor risk appetite. Recent reporting also showed Bitcoin encountering resistance around the $85,000 area after its rapid advance, demonstrating why technical analysis remains important even when broader market conditions appear supportive.
This Bitcoin Analysis examines the major factors currently shaping BTC, explains important technical concepts, discusses institutional demand and ETF flows, and explores the risks traders and long-term market participants should understand. Rather than relying on a single prediction, the goal is to provide a structured view of the Bitcoin market and the indicators that can help readers interpret future price movements.
What Bitcoin Analysis Really Means
Bitcoin Analysis is the process of examining Bitcoin’s market behavior from multiple perspectives. Traders commonly use technical analysis, while long-term participants may focus more heavily on fundamentals, adoption, network activity, monetary conditions, and supply dynamics.
Technical analysis studies price charts and indicators such as moving averages, support and resistance, RSI, MACD, trendlines, and trading volume. Fundamental analysis looks at Bitcoin’s underlying network, adoption, institutional participation, regulatory environment, liquidity, and broader economic conditions.
Neither approach can guarantee future price movements. Bitcoin operates in a highly volatile market where unexpected events can rapidly change sentiment. Therefore, effective BTC analysis is generally based on multiple signals rather than a single indicator.
Why Bitcoin Analysis Matters
Bitcoin’s market has become increasingly connected to traditional financial markets. Institutional investors can now obtain exposure through regulated financial products, while Bitcoin derivatives allow traders to take leveraged positions. As a result, BTC can react to developments in stocks, interest rates, currencies, commodities, and global liquidity.
Recent market coverage has highlighted Bitcoin’s growing relationship with technology stocks and broader risk appetite. MarketWatch reported that the latest Bitcoin rally occurred alongside strength in technology and AI-related equities.
This makes crypto market analysis more complex than simply examining Bitcoin’s historical price patterns.
Bitcoin Price Trends in September 2026
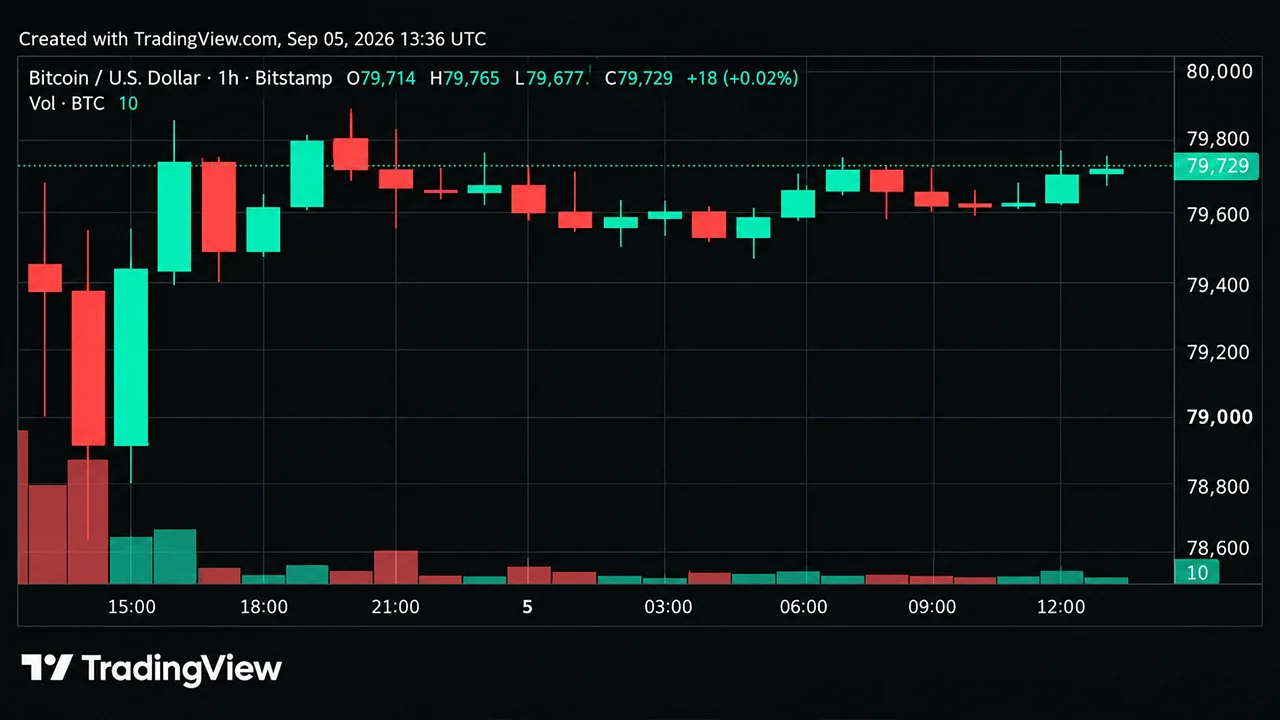
Recent BTC Price Movement
Bitcoin has experienced substantial volatility throughout 2026. After periods of weakness and consolidation, BTC recently moved sharply higher, briefly trading above $86,000. The Wall Street Journal reported that Bitcoin reached approximately $86,054 during a recent rally, gaining around 6% in one session and more than 30% from August 19.
Other financial coverage placed the recent high above $87,000, illustrating how quickly Bitcoin’s price can change depending on the exact time and exchange used for measurement. Barron’s reported Bitcoin reaching an eight-month high of approximately $87,359 and gaining 8.8% during September after a 25% rise in August.
These figures highlight an important point for anyone performing Bitcoin price analysis: cryptocurrency prices are continuously changing, so a published price should always be associated with a specific date and time.
The Importance of the $85,000 Area
Recent market analysis has identified the $85,000 region as an important short-term area. Bitcoin’s move above this level demonstrated strong buying interest, but subsequent trading showed that the market was still testing whether the breakout could develop into sustained support.
A recent Bitcoin analysis reported BTC pulling back toward approximately $83,150 after encountering resistance near $85,000. The report also highlighted an ascending trendline and nearby support as important technical areas.
For traders, this distinction matters. Breaking through resistance is one event; maintaining price above that resistance is another. A breakout supported by strong volume and continued buying pressure can have different implications from a brief move above resistance followed by a rapid reversal.
Technical Bitcoin Analysis
Support and Resistance
Support and resistance levels are among the most widely used concepts in technical analysis. Support represents a price area where buying interest has historically appeared, while resistance represents an area where selling pressure has previously increased.
These levels should not be treated as perfectly precise numbers. Bitcoin can move through them temporarily before reversing, particularly during periods of high volatility.
In the current market environment, recent reporting has focused on the $83,000–$85,000 region as an important short-term area. A sustained move above resistance could change the market structure, while failure to hold important support could increase the probability of another consolidation phase.
Moving Averages and Market Structure
Moving averages smooth Bitcoin’s historical price data and help traders identify broader trends. Short-term moving averages can show recent momentum, while longer-term averages provide context for the larger market structure.
A commonly watched indicator is the 200-day moving average. When Bitcoin trades significantly above a long-term moving average, traders may interpret the market structure as stronger than when price remains below it. However, moving averages are lagging indicators and should not be used independently.
Recent market coverage has also pointed to a golden cross as one of the technical developments supporting the current Bitcoin rally.
RSI and Momentum
The Relative Strength Index (RSI) measures the speed and magnitude of recent price changes. Traders frequently use RSI to identify periods of strong momentum and potential overextension.
A high RSI does not automatically mean Bitcoin must fall. Similarly, a low RSI does not guarantee a rebound. During powerful trends, an asset can remain overbought or oversold for extended periods.
For this reason, RSI is more useful when combined with price structure, volume, moving averages, and other market indicators.
Bitcoin ETF Flows and Institutional Demand
Why Spot Bitcoin ETFs Matter
One of the most important developments in modern Bitcoin market analysis is the growth of spot Bitcoin exchange-traded funds. These products provide traditional investors with exposure to Bitcoin through conventional financial markets.
ETF flows can provide information about institutional and professional investor demand. When substantial money enters spot Bitcoin ETFs, the funds generally need to acquire Bitcoin or maintain exposure through their underlying structure. This can connect traditional investment flows with the underlying Bitcoin market.
Recent reports have shown particularly strong ETF activity. One September report described the largest weekly U.S. spot Bitcoin ETF inflows of 2026 at approximately $2.39 billion.
Another report noted nearly $1 billion of Bitcoin ETF inflows in a single day and approximately $1.59 billion across three sessions.
These figures demonstrate why Bitcoin ETF flows have become an important metric for market observers.
ETF Inflows Are Not a Guaranteed Price Signal
Although ETF inflows can provide evidence of demand, they should not be interpreted as a guaranteed predictor of future Bitcoin prices. Markets can absorb significant buying while prices remain range-bound, especially when other participants are selling.
The recent Bitcoin market provides an example. Strong ETF inflows have occurred alongside resistance around the mid-$80,000s, showing that institutional demand and price appreciation do not always move in a perfectly direct relationship.
This is why ETF data should be considered alongside trading volume, derivatives positioning, macroeconomic conditions, and technical structure.
Macroeconomic Factors Affecting Bitcoin
Interest Rates and Federal Reserve Policy
Bitcoin is increasingly influenced by monetary policy. Changes in interest rates affect borrowing costs, liquidity, bond yields, and the attractiveness of risk assets.
When interest rates and Treasury yields rise, investors can sometimes become more cautious about speculative assets. When financial conditions become more accommodative, demand for risk assets can increase.
However, Bitcoin does not always follow this relationship perfectly. Recent reporting showed Bitcoin advancing even after a Federal Reserve rate hike, demonstrating that multiple factors can outweigh a single macroeconomic signal in the short term.
Inflation, Liquidity and the U.S. Dollar
Inflation data can influence expectations about future monetary policy, while liquidity conditions can affect the amount of capital available for risk-taking.
The U.S. dollar is also important because Bitcoin is primarily quoted in dollars across major global markets. Changes in dollar strength can influence international purchasing power and investor positioning.
Therefore, a complete Bitcoin market analysis should monitor inflation data, Federal Reserve decisions, Treasury yields, dollar movements, and global liquidity rather than treating Bitcoin as an isolated asset.
Bitcoin On-Chain Analysis
Understanding Blockchain Data
Unlike traditional financial assets, Bitcoin operates on a transparent public blockchain. This provides researchers with information about transactions, wallet activity, exchange balances, realized prices, and other network metrics.
On-chain analysis attempts to interpret this data to understand market behavior. Analysts may examine whether long-term holders are accumulating, whether coins are moving toward exchanges, or whether realized profits and losses are increasing.
On-chain metrics can provide valuable context, but they also have limitations. A blockchain address does not necessarily represent one individual, company, or investor. Large entities can use multiple addresses, while exchanges can control addresses containing coins belonging to many customers.
Exchange Balances and Selling Pressure
Bitcoin exchange balances are frequently monitored because coins transferred to exchanges can potentially become available for trading. However, movement to an exchange does not automatically mean that a holder intends to sell.
Similarly, withdrawals from exchanges can indicate long-term custody but may also reflect operational or institutional transfers.
For this reason, Bitcoin on-chain analysis is most informative when several metrics point toward the same market behavior.
Bitcoin Supply and Long-Term Fundamentals
The 21 Million Supply Limit
Bitcoin’s maximum supply is designed to be 21 million BTC. This fixed-supply characteristic is one of the central elements of its monetary design.
New Bitcoin enters circulation through the mining process, while the issuance rate changes according to the protocol’s scheduled halving mechanism. These supply characteristics distinguish Bitcoin from fiat currencies whose supply is controlled through monetary institutions and banking systems.
Scarcity alone, however, does not determine price. Bitcoin’s market value depends on the interaction between supply and demand. If demand weakens, a limited supply does not prevent price declines.
Bitcoin Halving and Market Cycles
Bitcoin’s halving mechanism reduces the amount of new BTC issued to miners over time. Historically, Bitcoin markets have experienced major cycles around these supply changes, although historical patterns do not guarantee future outcomes.
The modern Bitcoin market is also influenced by factors that were less significant during earlier cycles, including spot ETFs, institutional custody, derivatives, regulatory developments, and increased integration with traditional financial markets.
Therefore, historical Bitcoin market cycles are useful for context but should not be treated as a precise timetable for future price movements.
Bitcoin Derivatives and Market Sentiment

Futures and Open Interest
Bitcoin futures and perpetual contracts allow traders to gain exposure without directly holding BTC. The amount of capital committed to these contracts is often measured through open interest.
Rising open interest alongside rising prices can indicate increased participation, but it can also mean that leverage is building. Excessive leverage can make markets vulnerable to rapid liquidations.
Recent reporting has pointed to increased activity in Bitcoin options and futures during the latest rally.
Short Covering and Liquidations
Short covering can contribute significantly to rapid Bitcoin rallies. When traders betting on falling prices close their positions, they may need to buy Bitcoin, adding temporary upward pressure.
Recent reports attributed part of the September rally to short covering and substantial crypto liquidations.
This is important because a rally driven partly by short covering can behave differently from one driven primarily by sustained spot-market accumulation. Analysts therefore need to distinguish between genuine new demand and temporary positioning effects.
Bitcoin Adoption and Institutional Participation
Growing Institutional Interest
Bitcoin’s market structure has changed considerably as institutional investors have gained more avenues for exposure. ETFs, custodial services, regulated derivatives, corporate treasury strategies, and financial infrastructure have expanded access.
Institutional participation can potentially increase liquidity and broaden Bitcoin’s investor base. At the same time, it can make Bitcoin more sensitive to traditional financial-market conditions.
The latest rally has occurred alongside strong activity in Bitcoin-related financial products and companies, demonstrating the growing connection between cryptocurrency and conventional capital markets.
Corporate Bitcoin Holdings
Companies that hold Bitcoin on their balance sheets can also influence market discussions. Recent reporting noted that Strategy added 950 BTC worth approximately $76 million during the latest period covered by the report.
Corporate accumulation does not guarantee higher Bitcoin prices, but it is a measurable component of the broader demand landscape.
Risks That Matter in Bitcoin Analysis
Volatility Remains a Major Factor
Bitcoin remains highly volatile. Large price movements can occur within hours because of changing sentiment, leverage, liquidity, regulatory announcements, macroeconomic developments, or unexpected market events.
A strong rally can therefore be followed by a substantial correction without necessarily changing the long-term structure of the market.
Regulatory and Policy Uncertainty
Regulation continues to play an important role in the cryptocurrency sector. Recent market coverage has discussed regulatory developments involving U.S. agencies and legislation, with investors responding to both positive and negative policy signals.
Regulatory changes can influence exchanges, stablecoins, institutional products, custody services, tokenization, and cryptocurrency companies. Because policies can change, regulatory headlines should be evaluated using official documents and reputable financial reporting rather than social-media speculation.
Liquidity and Leverage Risks
High leverage can amplify both gains and losses. When too many traders hold highly leveraged positions in the same direction, a relatively modest price movement can trigger forced liquidations.
This can create rapid cascades where Bitcoin moves much further than expected based on ordinary spot-market demand.
How to Approach Bitcoin Analysis
A useful approach is to combine several forms of evidence instead of depending on one indicator. Technical analysis can explain market structure, while ETF flows can provide information about institutional demand. On-chain metrics can provide insight into blockchain activity, while derivatives data can reveal positioning and leverage.
Macroeconomic analysis adds another layer by examining interest rates, inflation, liquidity, Treasury yields, and the U.S. dollar.
The most important principle is context. A technical breakout accompanied by strong volume and ETF inflows may tell a different story from a breakout occurring while liquidity is weak and leverage is excessive.
Similarly, a short-term correction does not automatically invalidate a longer-term trend. Bitcoin’s historical volatility means that market participants should distinguish between ordinary fluctuations and genuine changes in structure.
Bitcoin Analysis Outlook
Current market data presents a mixed but highly active environment. Bitcoin has recently traded around the mid-$80,000 range after reaching an eight-month high, while the $85,000 area has emerged as an important technical reference point. Strong spot ETF flows provide evidence of substantial demand, while macroeconomic conditions, regulation, and derivatives positioning remain important variables.
The next phase of the market will depend on how these factors interact. Sustained demand, stable liquidity, and continued institutional participation could support market strength, while weaker ETF flows, higher yields, regulatory uncertainty, or excessive leverage could contribute to renewed volatility.
Rather than focusing on a single Bitcoin price prediction, investors and researchers can monitor whether price continues to establish higher highs and higher lows, whether major support levels hold, whether volume confirms breakouts, and whether institutional flows remain consistent.
Conclusion
Bitcoin remains one of the most closely analyzed assets in global financial markets. A comprehensive Bitcoin Analysis requires more than checking today’s BTC price. Technical structure, ETF flows, institutional demand, on-chain activity, derivatives positioning, Bitcoin supply dynamics, regulation, interest rates, liquidity, and investor sentiment all contribute to the market’s behavior.
The latest September 2026 market environment illustrates this complexity. Bitcoin has experienced a significant recovery and recently reached an eight-month high, while strong ETF inflows have provided an important source of demand. At the same time, resistance around the mid-$80,000s and changing macroeconomic conditions demonstrate that volatility remains an important consideration.
For anyone following Bitcoin price analysis, the most useful approach is to monitor multiple independent signals and understand their limitations. Bitcoin can respond quickly to new information, making certainty difficult even when several indicators appear aligned.
Ultimately, Bitcoin analysis is about understanding the forces behind price movements rather than attempting to predict every short-term fluctuation. By combining technical indicators, fundamental developments, on-chain data, ETF flows, and macroeconomic information, readers can develop a clearer framework for interpreting the evolving Bitcoin market.
Frequently Asked Questions
What is Bitcoin Analysis?
Bitcoin Analysis is the study of Bitcoin’s price, market structure, fundamentals, network activity, investor sentiment, derivatives, ETF flows, and broader economic factors. It can include both technical and fundamental analysis.
Why are Bitcoin ETF flows important?
Bitcoin ETF flows can provide information about demand from investors accessing BTC through traditional financial markets. Strong inflows can indicate increased demand, although ETF flows alone cannot guarantee future price movements.
What are the most important Bitcoin technical indicators?
Common indicators include support and resistance, moving averages, RSI, MACD, trading volume, trendlines, and market structure. Traders generally obtain more context by combining several indicators instead of relying on one.
What affects the Bitcoin price?
Bitcoin’s price is influenced by supply and demand, investor sentiment, institutional flows, ETF activity, liquidity, interest rates, regulation, derivatives positioning, macroeconomic conditions, and developments within the cryptocurrency ecosystem.
Is Bitcoin analysis useful for long-term investors?
Bitcoin analysis can provide useful information about market conditions Bitcoin Analysis and underlying trends, but it cannot eliminate uncertainty. Long-term participants may combine market analysis with research into Bitcoin’s technology, adoption, supply structure, regulation, and overall risk.