Hassan malik
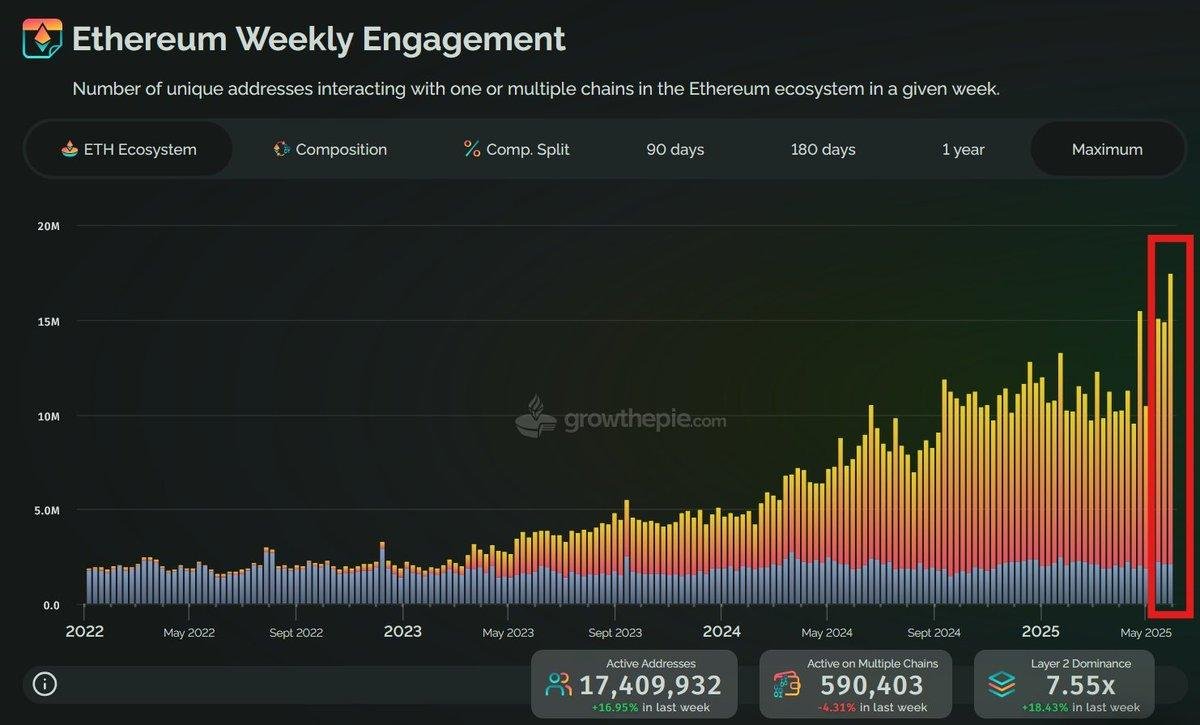
Ethereum Analysis has become increasingly important as Ethereum continues Ethereum Analysis to play a central role in the cryptocurrency industry. While Bitcoin is primarily recognized as a decentralized digital asset and monetary network, Ethereum has developed into a programmable blockchain infrastructure supporting smart contracts, decentralized applications, decentralized finance, stablecoins, tokenized assets, and a growing Layer 2 ecosystem.
The price of Ethereum can change rapidly because ETH is influenced by both the broader cryptocurrency market and developments specific to the Ethereum network. Bitcoin’s direction, market liquidity, institutional activity, regulatory developments, staking demand, network usage, and investor sentiment can all affect Ethereum price.
Current September 2026 data illustrates this complexity. On September 28, CoinMarketCap reported ETH around $2,656 after a 1.57% 24-hour decline, with the move occurring alongside weakness across the broader crypto market. Its analysis identified $2,580 as an important technical support area and $2,800 as a significant resistance level.
At the same time, Ethereum’s longer-term development remains active. The Ethereum Foundation reported in September that the Glamsterdam upgrade was in public testing, while developers continued work on future protocol improvements.
This makes Ethereum Analysis a combination of price analysis, technical analysis, fundamental research, network activity, token economics, and ecosystem development. Understanding these areas can help readers form a more complete picture of Ethereum without relying on a single price indicator or market prediction.
What Is Ethereum?
Ethereum is a decentralized blockchain platform designed to support programmable applications through smart contracts. The network was launched in 2015 and has since developed into one of the most widely used blockchain ecosystems.
ETH is Ethereum’s native cryptocurrency. It is used to pay transaction fees, interact with applications, and participate in Ethereum’s proof-of-stake consensus system.
Unlike a conventional database controlled by one organization, Ethereum operates through a distributed network of participants. Transactions and smart-contract activity are recorded on the blockchain according to the network’s protocol rules.
Ethereum as a Programmable Blockchain
The concept of programmability is central to Ethereum. Developers can deploy smart contracts that automatically execute predefined instructions when specific conditions are met.
This capability has supported the development of decentralized finance, NFT platforms, decentralized exchanges, lending protocols, stablecoin infrastructure, gaming applications, and tokenization systems.
Consequently, Ethereum Analysis should not focus only on ETH’s market price. Network usage and ecosystem development can also provide important information about the blockchain’s activity.
Ethereum Price and Current Market Structure
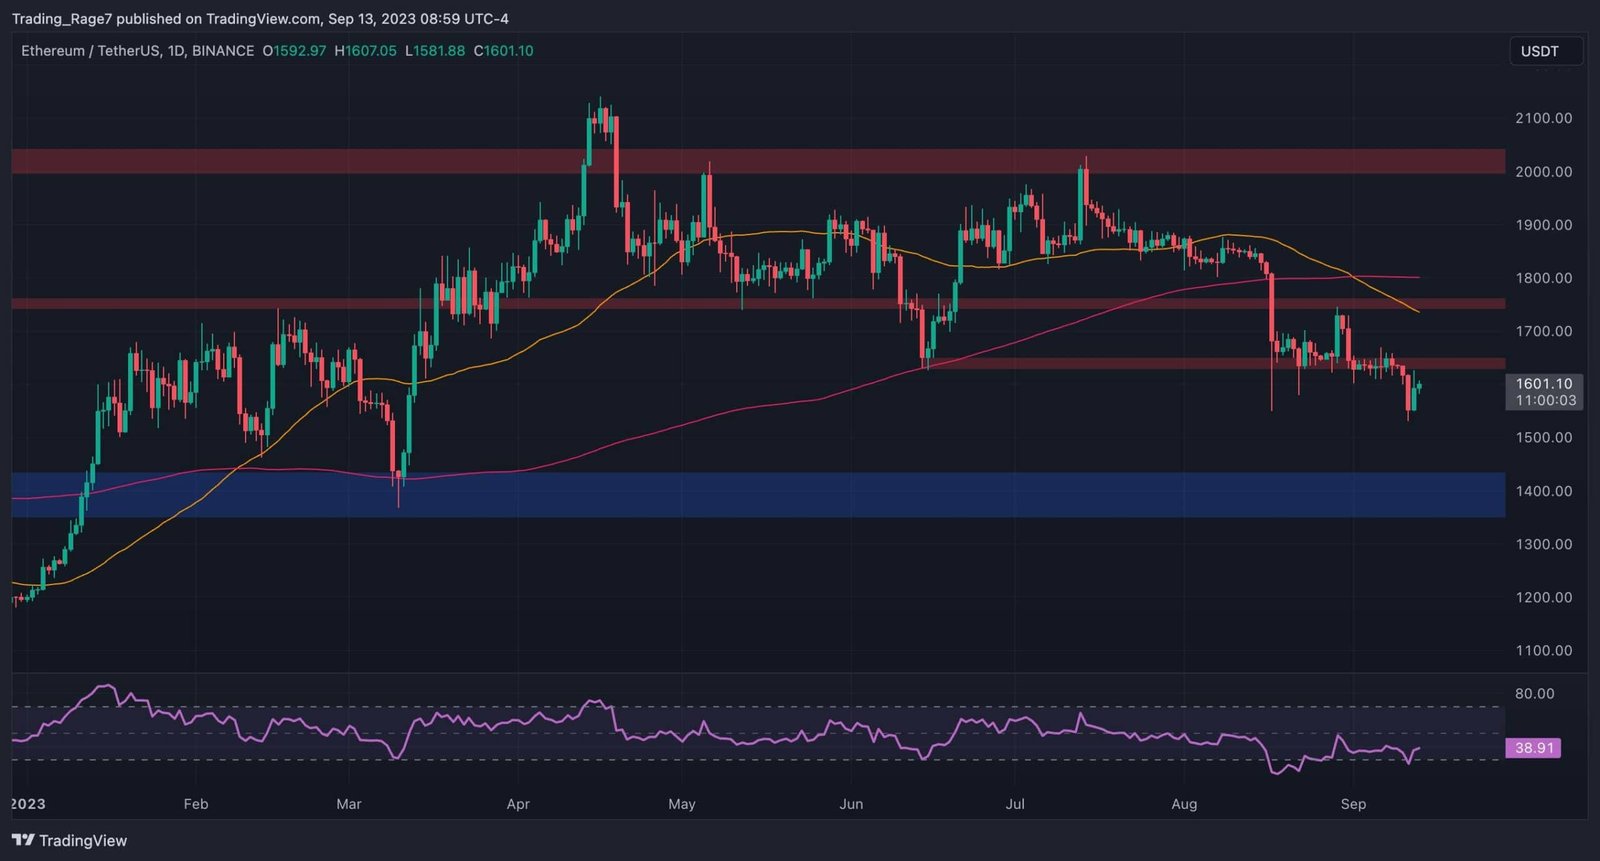
Ethereum price is determined by supply and demand across global cryptocurrency markets. ETH trades continuously, meaning price conditions can change throughout the day.
On September 28, 2026, CoinMarketCap reported ETH at approximately $2,656.35, down 1.57% over 24 hours. Its analysis linked the decline to broader crypto-market weakness, a technical rejection around $2,800, and selling pressure following an exploit involving more than 766 ETH.
This illustrates why current Ethereum Analysis needs to consider both technical and fundamental developments.
Recent ETH Price Movement
Ethereum’s recent market structure has shown both upward momentum and short-term resistance. Coinlib’s September 27 analysis reported ETH around $2,695.99, with a 4.27% seven-day gain and an 8.18% increase over 30 days at that time.
However, market conditions can change quickly. The following day, CoinMarketCap reported ETH below $2,700 after a daily decline.
These changes demonstrate why a single price snapshot should not be treated as a complete Ethereum market analysis.
Ethereum Technical Analysis
Technical analysis examines historical price behavior, trading volume, momentum, support and resistance, moving averages, chart patterns, and other market indicators.
For Ethereum, technical analysis can help explain where buyers and sellers have previously become active.
Ethereum Support and Resistance
Support represents a price area where buying activity has historically appeared, while resistance represents an area where selling pressure has previously become stronger.
Current market analysis has identified approximately $2,580 as an important ETH support level, while $2,700–$2,800 has been an important area of resistance. CoinMarketCap’s September 28 analysis noted that a break below $2,580 could expose ETH to lower support around $2,450.
These levels should be treated as analytical reference points rather than guaranteed future price outcomes.
Ethereum Moving Averages
Moving averages smooth historical price data and can help identify broader trends.
Shorter moving averages respond more quickly to recent price movements, while longer moving averages provide a broader view of market direction.
Ethereum’s recent technical structure has been notable because ETH moved above several important technical levels during its late-August and September rally. Reuters reported on September 22 that ETH had moved above its 10-day moving average and a trendline from its February high.
Moving averages should not be used alone. Traders often combine them with volume, support, resistance, and market structure.
Ethereum Bull Flag and Breakout Analysis
One of the major technical developments in recent Ethereum Analysis was the reported breakout from a bull flag pattern.
Reuters reported on September 22 that Ethereum had broken above the September 11 high of $2,661.52 after consolidating following a rally of more than 30% in late August. The report described the move as a technical breakout and identified additional areas where consolidation could occur.
A bull flag generally consists of a strong upward move followed by a period of relatively narrow consolidation. A breakout above the upper boundary can be interpreted by technical analysts as a continuation signal.
However, chart patterns do not guarantee future price movements. Reuters itself noted that its technical analysis assesses possible price behavior rather than guaranteeing an outcome.
Ethereum RSI and Momentum
The Relative Strength Index (RSI) is commonly used in Ethereum technical analysis to study momentum.
RSI ranges from 0 to 100. Traditional technical analysis often considers readings above 70 to represent overbought conditions and readings below 30 to represent oversold conditions.
However, these levels should not automatically be interpreted as signals to buy or sell. During a strong trend, RSI can remain elevated or depressed for extended periods.
RSI Divergence
RSI divergence occurs when price and momentum indicators move in different directions.
For example, Ethereum could establish a higher price high while RSI produces a lower high. Some analysts interpret this as evidence that momentum may be weakening.
Divergence is better viewed as a warning or observation rather than a guaranteed reversal signal.
Ethereum Trading Volume
Trading volume provides additional information about market participation.
When Ethereum breaks above resistance with significantly higher volume, analysts may view the move as having stronger participation than a breakout occurring during unusually low volume.
Volume can also help evaluate whether a sell-off is attracting significant market activity or whether price is simply drifting lower during thin trading.
For a complete Ethereum Analysis, price and volume are therefore often considered together.
Ethereum DeFi Ecosystem
One of Ethereum’s biggest strengths is its connection to decentralized finance, commonly called DeFi.
Ethereum helped establish a major ecosystem of decentralized exchanges, lending platforms, derivatives protocols, stablecoins, staking applications, and other financial services.
Why DeFi Matters for Ethereum
DeFi activity can create demand for Ethereum because many applications use ETH for transaction fees and other network functions.
However, Ethereum’s relationship with DeFi has also evolved as Layer 2 networks have expanded.
Lower-cost Layer 2 networks can process activity away from Ethereum’s main execution layer while using Ethereum for security or settlement functions.
This creates an important area for future Ethereum Analysis: Ethereum’s success should not necessarily be measured only by activity directly taking place on the main chain.
Ethereum Layer 2 Networks
Layer 2 scaling is designed to increase blockchain transaction capacity while reducing costs or improving transaction efficiency.
Layer 2 networks can process transactions separately from Ethereum’s main chain and then use Ethereum for settlement or security-related functions, depending on their design.
This approach has become an important part of Ethereum’s scalability strategy.
Why Layer 2 Matters to ETH
Layer 2 adoption can have both direct and indirect implications for Ethereum.
More users and applications can potentially access Ethereum-based infrastructure at lower costs, while Ethereum remains an important settlement layer.
However, analysts need to examine how economic value is distributed across Ethereum and its Layer 2 ecosystem. Metrics such as transaction activity, fees, developer adoption, and application usage can provide additional context.
Ethereum Staking
Ethereum transitioned from proof of work to proof of stake in 2022.
Under proof of stake, validators help secure the network by committing ETH according to Ethereum’s consensus rules.
Staking can contribute to the network’s security while allowing eligible participants to receive rewards.
ETH Supply and Staking
Ethereum does not have the same fixed 21-million maximum supply as Bitcoin.
Instead, Ethereum’s supply dynamics depend on issuance, staking, network activity, and mechanisms such as the EIP-1559 fee burn.
During periods of high network activity, the amount of ETH burned through transaction fees can become an important part of the network’s supply dynamics.
For Ethereum Analysis, this means analysts may examine both ETH issuance and ETH burn rather than focusing solely on circulating supply.
Ethereum Network Upgrades
Ethereum’s long-term development depends heavily on protocol upgrades.
In September 2026, the Ethereum Foundation reported that the Glamsterdam hard fork was in public testing, while work on future upgrades and protocol priorities continued.
CoinDesk also reported that Ethereum developers had scheduled public testing activities while addressing potential issues involving malicious builders during testnet development. The report emphasized that these concerns related to testing infrastructure rather than threatening funds on Ethereum mainnet.
Network upgrades are important because they can influence Ethereum’s scalability, efficiency, security, and developer experience.
Ethereum Institutional Adoption
Institutional interest is another important factor in Ethereum Analysis.
Financial institutions and asset managers can gain exposure to ETH through various regulated products and market structures. Institutional activity can influence liquidity, demand, and market perception.
Corporate holders have also attracted attention. For example, a September 2026 company announcement from Bitmine Immersion Technologies stated that the company held approximately 5.93 million ETH and represented 4.9% of the total ETH supply according to its own reported figures.
Company-reported holdings should be distinguished from independently verified market-wide data, but such announcements demonstrate the growing role of corporate ETH exposure in market discussions.
Ethereum and Bitcoin Relationship

Ethereum and Bitcoin remain closely connected within the broader cryptocurrency market.
Bitcoin often influences overall crypto liquidity and investor sentiment, while Ethereum has additional price drivers related to network activity, DeFi, staking, Layer 2 adoption, and applications.
When Bitcoin experiences a major market move, ETH can respond alongside it. However, Ethereum can also outperform or underperform Bitcoin depending on Ethereum-specific developments.
ETH/BTC Ratio
The ETH/BTC ratio compares Ethereum’s price with Bitcoin’s price.
Analysts sometimes use this ratio to understand Ethereum’s relative performance against Bitcoin.
A rising ratio means ETH is gaining value relative to BTC, while a declining ratio means Bitcoin is outperforming Ethereum over the measured period.
This can be useful for understanding capital rotation within the cryptocurrency market.
Ethereum and Institutional Demand
Institutional demand can influence Ethereum through investment products, custody services, corporate holdings, and professional trading.
However, institutional flows can change quickly depending on market conditions.
Therefore, Ethereum Analysis should consider institutional demand as one component of a larger framework that includes price structure, on-chain activity, liquidity, regulation, and network development.
Ethereum Market Risks
Ethereum has significant technological and market risks.
The first is price volatility. ETH can experience large price movements over short periods.
Another risk involves smart contracts. Ethereum’s infrastructure may be robust, but individual applications built on Ethereum can contain vulnerabilities.
There are also regulatory risks. Governments can change their treatment of cryptocurrency exchanges, staking services, decentralized applications, and digital assets.
Network upgrades also involve technical complexity. Testing and development are designed to identify potential problems before deployment, but software systems can still encounter unexpected issues.
Ethereum Security and Recent Exploit Concerns
Security is an important part of Ethereum Analysis because activity across the wider ecosystem includes numerous smart contracts, bridges, applications, and wallets.
CoinMarketCap’s September 28 analysis cited selling pressure following a bridge exploit involving more than 766 ETH.
It is important to distinguish an exploit involving an application or bridge from a failure of Ethereum’s underlying blockchain. Security incidents within the broader ecosystem can nevertheless affect market sentiment toward ETH.
For users, this highlights the importance of understanding the difference between the Ethereum protocol and individual applications built on top of it.
Ethereum Fundamental Analysis
Fundamental Ethereum Analysis focuses on the underlying health and adoption of the Ethereum ecosystem.
Important metrics can include active addresses, transaction activity, developer activity, decentralized application usage, staking participation, fees, ETH burn, Layer 2 activity, and total value locked in DeFi.
No single metric provides a complete picture.
For example, increasing transaction activity can be positive for network usage, but analysts may also need to examine whether that activity is sustainable and economically meaningful.
Ethereum Market Sentiment
Crypto market sentiment can have a major influence on ETH.
Positive sentiment can increase demand and trading activity, while negative sentiment can lead to rapid selling.
Sentiment can be influenced by Bitcoin’s performance, macroeconomic announcements, ETF flows, regulatory developments, protocol upgrades, and security incidents.
The current market demonstrates this relationship. CoinMarketCap reported on September 28 that ETH’s decline was closely connected to broader market weakness, with Bitcoin and total crypto market capitalization also falling over the preceding 24 hours.
Ethereum Price Outlook Factors
Instead of relying on a single Ethereum price prediction, it can be more useful to monitor the factors that could influence future price behavior.
Important areas include Bitcoin’s trend, ETH trading volume, support and resistance, institutional flows, staking activity, Layer 2 adoption, network upgrades, regulatory developments, and broader macroeconomic liquidity.
Current technical analysis places considerable attention on the $2,580 support area and the $2,700–$2,800 region.
These are market-analysis reference points, not guarantees of future price movements.
The Future of Ethereum
Ethereum’s future development will likely depend on its ability to scale while maintaining security, decentralization, and developer adoption.
The growth of Layer 2 networks, stablecoins, tokenized real-world assets, DeFi, institutional products, and decentralized applications could continue expanding the Ethereum ecosystem.
At the same time, Ethereum faces competition from other Layer 1 and Layer 2 blockchain networks.
Future Ethereum Analysis will therefore need to consider not only ETH price but also how effectively the network continues to support users, developers, applications, and financial infrastructure.
How to Approach Ethereum Analysis
A balanced Ethereum Analysis can begin with the broader crypto market before moving toward Ethereum-specific factors.
Bitcoin’s direction can provide macro context. ETH’s price structure can then be examined through support, resistance, moving averages, volume, and momentum.
The next step is fundamental analysis. Network activity, staking, DeFi, Layer 2 growth, developer activity, and protocol upgrades can provide insight into the ecosystem.
Finally, analysts should consider risks including volatility, regulation, security incidents, liquidity, and competition.
This approach avoids relying on one indicator and creates a more complete understanding of Ethereum’s market environment.
Conclusion
Ethereum Analysis requires a combination of technical, fundamental, and ecosystem-level research. ETH is not simply another cryptocurrency whose value can be understood by looking at a price chart. Ethereum supports a broad blockchain economy involving smart contracts, DeFi, stablecoins, Layer 2 networks, staking, tokenization, and decentralized applications.
As of September 28, 2026, ETH was trading around $2,656 according to CoinMarketCap’s latest analysis, with $2,580 identified as an important support area and $2,800 as a notable resistance level. Earlier in September, Reuters reported that ETH had broken above a bull-flag formation and moved through the $2,661.52 level, demonstrating the changing technical structure of the market.
Ethereum’s fundamentals are also developing. The Ethereum Foundation reported that the Glamsterdam upgrade was in public testing, while developers continued evaluating future protocol priorities.
For anyone studying Ethereum Analysis, the key is to combine price data with network fundamentals, technical indicators, ecosystem activity, institutional participation, and risk factors. No single metric can fully explain Ethereum’s market behavior.
As Ethereum continues to evolve, its role in decentralized finance, blockchain infrastructure, tokenization, and digital applications will remain important areas to watch. The combination of technological development and market activity makes Ethereum one of the most significant ecosystems in the cryptocurrency industry.
Frequently Asked Questions
What is Ethereum Analysis?
Ethereum Analysis is the study of ETH price movements, technical indicators, network activity, token economics, staking, DeFi, Layer 2 adoption, market sentiment, and other factors that can influence Ethereum.
What is the current Ethereum price?
On September 28, 2026, CoinMarketCap reported Ethereum at approximately $2,656.35, although cryptocurrency prices change continuously and can differ slightly between exchanges.
What are the important Ethereum support and resistance levels?
Current market analysis has identified approximately $2,580 as an important support area and $2,700–$2,800 as a significant resistance region. These levels can change as new price data develops.
What makes Ethereum different from Bitcoin?
Bitcoin primarily functions as a decentralized digital asset and payment network, while Ethereum is designed as a programmable blockchain capable of supporting smart contracts and decentralized applications.
What factors affect Ethereum price?
Ethereum price can be influenced by Bitcoin’s performance, market liquidity, institutional demand, staking, network activity, DeFi, Layer 2 adoption, regulation, macroeconomic conditions, and investor sentiment.
Is Ethereum technical analysis reliable?
Technical analysis can help identify trends, support, resistance, Ethereum Analysis momentum, and market structure, but it cannot guarantee future price movements. It is generally more useful when combined with fundamental and market-context analysis.