Hassan malik
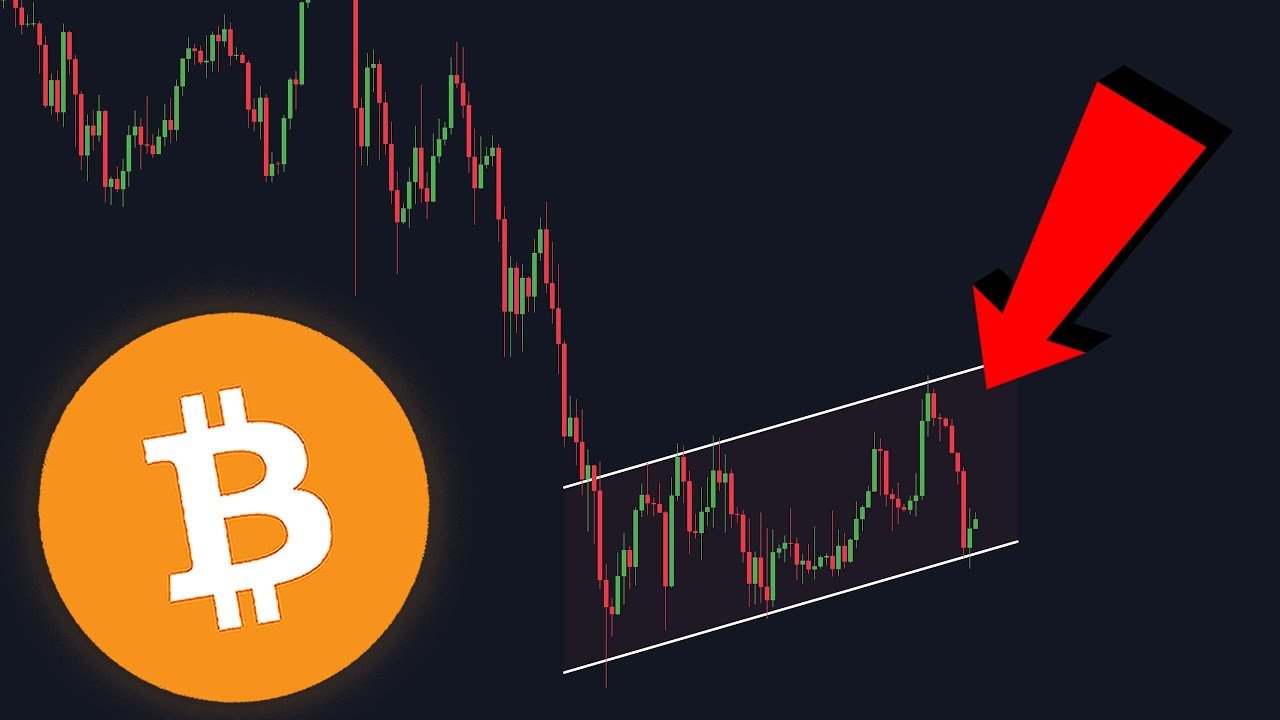
The Bitcoin Price Breakout has become one of the most closely watched developments in the cryptocurrency market as Bitcoin moves through important technical levels in early October 2026. After spending much of the previous week struggling around the $85,000 area, Bitcoin finally moved above that level, briefly reaching approximately $86,857 to $86,885 on October 2.
A Bitcoin breakout occurs when BTC moves decisively beyond an established resistance or trading range. However, simply moving above resistance does not automatically confirm a sustainable trend. Traders usually look for Bitcoin trading volume, daily or weekly closes, liquidity conditions, ETF flows, and broader market momentum to determine whether a breakout is being sustained.
Recent market conditions provide several important factors to examine. Bitcoin’s move above $85,000 came as investors responded to changing expectations around U.S. monetary policy and weaker-than-expected employment data. Reuters reported that U.S. nonfarm payrolls increased by only 29,000 in September, compared with economists’ expectation of 90,000, while market expectations for an October Federal Reserve rate hike declined.
At the same time, cryptocurrency market participants are monitoring ETF flows and order-book liquidity. Cointelegraph reported that U.S. spot Bitcoin ETFs recorded $102.7 million in net inflows on October 1, while Glassnode noted that stronger ETF inflows and higher trading volume would provide additional confirmation for a broader Bitcoin uptrend.
Understanding the current Bitcoin Price Breakout therefore requires more than looking at BTC’s latest price. This article examines the technical structure, resistance and support levels, trading volume, ETF demand, macroeconomic conditions, market liquidity, and the factors that could determine whether the breakout develops into a larger move.
What Is a Bitcoin Price Breakout?
A Bitcoin Price Breakout happens when Bitcoin moves outside a clearly defined trading range or above an established resistance level. Traders often view a breakout as a potential change in market structure because it can indicate that buying pressure has become strong enough to absorb available selling orders.
For example, if Bitcoin repeatedly encounters resistance near a particular price and eventually moves above it with increasing volume, traders may consider that a confirmed BTC breakout. The important distinction is between a temporary price spike and a sustained breakout.
A temporary move above resistance can become a false breakout if buyers fail to maintain control and Bitcoin quickly falls back into its previous range. For this reason, technical traders frequently wait for confirmation through closing prices, volume, momentum, and subsequent retests.
Why Breakout Confirmation Matters
Confirmation is important because cryptocurrency markets can experience sharp intraday movements. Bitcoin can temporarily move through a resistance zone because of leveraged positions, liquidations, low liquidity, or sudden news.
A stronger breakout generally involves Bitcoin holding above the former resistance rather than immediately falling below it. In some cases, the previous resistance becomes new Bitcoin support, creating a higher market structure.
This is why traders often monitor several timeframes rather than relying on a single hourly candle.
Bitcoin Breaks Above $85,000
The $85,000 level has recently attracted considerable attention. TradingView reported that Bitcoin was trading near $85,866 on October 2 after gaining about 2.9% over 24 hours and moving above $85,000 after several unsuccessful attempts.
Cointelegraph separately reported that Bitcoin reached $86,857 on Bitstamp after buyers moved through sell orders around $85,000. The publication also noted that more than $120 million in Bitcoin short positions were liquidated over a 24-hour period.
This makes $85,000 an important reference point for understanding the current Bitcoin Price Breakout.
The Importance of the $85,000 Zone
The significance of $85,000 comes partly from the amount of trading activity and selling pressure that previously appeared around this region. When buyers finally absorb that supply, the market can move quickly because traders who were positioned for a decline may close their positions.
This can create additional buying pressure through short covering.
However, the sustainability of the move remains important. A breakout above $85,000 followed by a successful retest would provide a different market structure from a quick spike above the level followed by a return below it.
Therefore, BTC price action above $85,000 is one of the key developments to monitor in the current market.
Bitcoin Resistance Levels After the Breakout

Once Bitcoin moves above a major resistance level, traders generally begin looking for the next areas where selling pressure could appear.
The move toward $86,000 and beyond has brought the $87,000 area into focus. Cointelegraph reported that a cluster of potential liquidations was positioned above $87,000, while Bitcoin reached its highest price since September 23 during the October 2 move.
The $87,000 Area
The $87,000 Bitcoin resistance is important because psychological price levels can attract both buyers and sellers. Traders who entered positions earlier may take profits as BTC approaches a round-number level, while breakout traders may increase exposure if price moves decisively above it.
A sustained move above $87,000 would change the immediate technical structure, but the market would still need to demonstrate that buyers can maintain momentum.
The important question is therefore not simply whether Bitcoin touches $87,000, but whether the market can maintain higher levels after reaching that zone.
The $90,000 Psychological Level
Beyond the immediate resistance near $87,000, the $90,000 area represents another major psychological level.
Round numbers often receive considerable attention in financial markets because they are easy for traders and investors to monitor. A move toward $90,000 could therefore attract increased trading activity, profit-taking, and speculative positioning.
The path between $87,000 and $90,000 may remain volatile, particularly if leverage increases rapidly.
Bitcoin Support After a Breakout
Resistance is only one side of breakout analysis. Bitcoin support levels are equally important because they help determine whether buyers remain active after a price advance.
A previous resistance level can sometimes become support after a successful breakout. In the current structure, the $85,000 area is therefore important to monitor.
If Bitcoin moves above $85,000 and remains there, traders may interpret that as evidence that the former resistance is becoming a support zone. If BTC falls back below the level quickly, the breakout could become less convincing.
Retesting the Breakout Level
A Bitcoin breakout retest occurs when BTC returns toward the level it previously broke above. This does not necessarily mean the breakout has failed.
If buyers step in and Bitcoin rebounds from the former resistance, the retest can demonstrate that market participants are willing to defend the new support.
Conversely, a decisive move back into the previous trading range can weaken the breakout structure.
This is why the price reaction around $85,000 may be as important as the initial move above the level.
Bitcoin Trading Volume and Breakout Strength
Trading volume is one of the most important indicators when analyzing a Bitcoin breakout. A price increase accompanied by strong volume can suggest broader participation than a move occurring during thin trading conditions.
Glassnode has emphasized the importance of renewed ETF inflows and higher trading volume for confirming broader support behind Bitcoin’s uptrend.
Why Volume Matters
Bitcoin trading volume represents the amount of BTC changing hands over a particular period. When volume expands alongside a breakout, it can indicate that more market participants are participating in the move.
However, volume should not be viewed in isolation. A large volume spike can also occur during a sharp sell-off or liquidation event.
The most useful approach is to compare volume with price structure, ETF flows, volatility, and market positioning.
Bitcoin ETF Flows and the Breakout
Spot Bitcoin ETFs have become an important part of the modern Bitcoin market. Their flows provide another source of information about institutional and traditional-market demand.
Cointelegraph reported that U.S. spot Bitcoin ETFs recorded approximately $102.7 million in net inflows on October 1. BlackRock’s iShares Bitcoin Trust accounted for approximately $195 million of inflows, although outflows from other funds reduced the overall daily figure.
Why ETF Demand Matters
Bitcoin ETF inflows can provide a useful indication of investor demand through traditional financial channels. Sustained inflows may create additional demand for Bitcoin exposure, while weaker flows can indicate reduced enthusiasm.
Still, ETF flows cannot independently confirm a breakout. Bitcoin’s price is influenced by numerous factors, including spot-market demand, derivatives, macroeconomic conditions, liquidity, and investor positioning.
A stronger technical breakout accompanied by sustained ETF demand would provide a more complete market signal than price movement alone.
Bitcoin Short Liquidations and Market Momentum
The current Bitcoin breakout has also been accompanied by significant short liquidations. Cointelegraph reported that Bitcoin short liquidations exceeded $120 million over 24 hours during the October 2 move.
A short liquidation occurs when a leveraged trader who expects an asset to decline is forced to close a position after the market moves against them.
How Short Squeezes Can Affect Bitcoin
When many traders are positioned short, a sudden upward move can force them to buy Bitcoin to close their positions. Those purchases can contribute additional upward pressure, creating what is commonly called a short squeeze.
This mechanism can accelerate a Bitcoin breakout, but it does not necessarily establish long-term demand.
After liquidations decline, the market needs fresh spot buying and sustainable participation to continue moving higher.
Bitcoin and U.S. Economic Data
Macroeconomic developments are playing an important role in the current Bitcoin market.
Reuters reported on October 2 that September U.S. nonfarm payrolls increased by just 29,000, significantly below the 90,000 increase expected by economists. The weaker employment data reduced market expectations for an October Federal Reserve rate hike.
Federal Reserve Expectations
Federal Reserve policy can influence Bitcoin through interest rates, liquidity, Treasury yields, and the U.S. dollar.
When investors expect monetary conditions to become less restrictive, risk assets can sometimes receive additional demand. Conversely, expectations for higher interest rates can put pressure on risk-sensitive assets.
The relationship is not mechanical, however. Bitcoin can rise even when traditional markets face higher yields, and it can decline despite favorable monetary expectations.
The current Bitcoin breakout therefore needs to be viewed within the broader macroeconomic environment.
Bitcoin Market Liquidity and Order Books
Liquidity is another important part of breakout analysis. A market with substantial sell orders above the current price can make it harder for buyers to move Bitcoin higher.
Cointelegraph reported that Bitcoin buyers broke through sell orders around $85,000, while reduced ask liquidity above that level helped BTC move more quickly toward $87,000.
Understanding Bitcoin Order-Book Liquidity
The Bitcoin order book contains outstanding buy and sell orders at different prices. Large clusters of sell orders can act as temporary resistance, while large buy orders can provide temporary support.
These liquidity walls can change quickly. Traders may cancel or add orders depending on market conditions.
Therefore, order-book data can help explain short-term price movements, but it should not be treated as a permanent map of future Bitcoin prices.
Bitcoin Technical Analysis and Market Structure

Technical analysis provides a framework for understanding the current Bitcoin Price Breakout.
Bitcoin had previously established a trading range around the mid-$80,000 area. The move above $85,000 represents an attempt to expand that range upward.
TradingView described the October 2 move as Bitcoin finally pushing through $85,000 after nearly a week of unsuccessful attempts.
Moving Averages and Momentum
Traders often use Bitcoin moving averages, RSI, MACD, and other technical indicators to evaluate momentum.
Moving averages can help identify the broader trend, while RSI can provide information about momentum conditions. However, indicators should be interpreted alongside actual price structure.
A strong Bitcoin breakout accompanied by improving volume and sustained closes above resistance generally provides more information than an isolated indicator reading.
Bitcoin Price Breakout: Bullish and Bearish Scenarios
The current market can be analyzed through different scenarios without assuming that any one outcome is guaranteed.
If Bitcoin Holds Above Resistance
If BTC maintains levels above the previous resistance area, the market could continue testing higher levels. Traders would likely monitor $87,000 and then the psychological $90,000 zone.
A successful retest of $85,000 could strengthen the technical structure by demonstrating that former resistance is functioning as support.
If Bitcoin Falls Back Below the Breakout
If Bitcoin quickly falls below $85,000 after the breakout, traders may question whether the move was sustainable.
A deeper return into the previous range could indicate that sellers remain active. In that situation, the market would need to establish another support area before attempting another breakout.
This is why Bitcoin breakout confirmation remains more important than a single intraday price spike.
Bitcoin Price Breakout and Market Sentiment
Market sentiment can change rapidly during major Bitcoin moves. A breakout often attracts attention from traders who were previously waiting for confirmation.
At the same time, rapidly rising prices can increase speculative activity and leverage.
The challenge is distinguishing genuine market demand from temporary momentum caused by liquidations or short-term speculation.
The Role of Investor Psychology
Bitcoin market sentiment can influence both trading volume and volatility. Fear can cause investors to sell quickly, while optimism can encourage traders to chase rising prices.
Psychological levels such as $85,000, $87,000, and $90,000 can therefore become important because large numbers of traders are watching them.
For long-term analysis, however, sentiment should be considered alongside Bitcoin’s network fundamentals, institutional adoption, regulatory environment, and broader market conditions.
What to Watch After the Bitcoin Price Breakout
The next stage of the market will depend on whether Bitcoin can convert its recent price advance into a sustained move.
The most important indicators include Bitcoin trading volume, daily and weekly closing prices, ETF flows, order-book liquidity, derivatives positioning, and macroeconomic developments.
A breakout that remains above former resistance while attracting sustained spot demand would represent a different market structure from a move driven primarily by short liquidations.
Investors and traders should therefore monitor how BTC behaves after the initial breakout rather than relying solely on the headline that Bitcoin has crossed a particular level.
Conclusion
The Bitcoin Price Breakout above $85,000 is one of the key developments in the cryptocurrency market at the beginning of October 2026. Bitcoin reached approximately $86,857–$86,885 during the October 2 move, while short liquidations and changing macroeconomic expectations contributed to the market’s momentum.
The next important areas are around $87,000 and the psychological $90,000 level, while $85,000 has become an important area to monitor for potential support. The strength of the breakout will depend on whether Bitcoin can maintain higher levels rather than simply moving above resistance temporarily.
ETF flows are another important factor. U.S. spot Bitcoin ETFs recorded approximately $102.7 million in net inflows on October 1, although daily flows can fluctuate significantly.
Macroeconomic conditions also remain relevant. Weaker-than-expected U.S. employment data reduced expectations for an October Federal Reserve rate hike, while Treasury yields remained elevated.
Overall, the latest Bitcoin Price Breakout provides an important technical development to monitor, but confirmation requires sustained price strength, healthy market participation, and supportive liquidity. By watching resistance, support, volume, ETF activity, derivatives, and macroeconomic conditions together, readers can develop a more complete understanding of Bitcoin’s evolving market structure.